# Technical Document Extraction: Model Accuracy vs. Target Axis
## 1. Image Classification
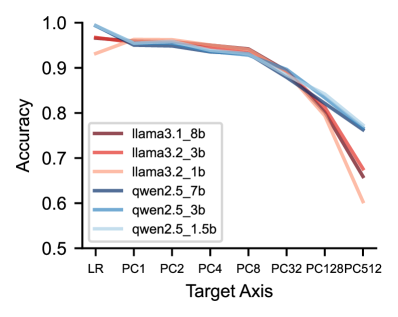
This image is a **line graph** comparing the performance (Accuracy) of six different Large Language Models (LLMs) across various "Target Axis" configurations.
## 2. Component Isolation
### Header/Metadata
* **Language:** English.
* **Title:** None present in the image.
### Main Chart Area
* **Y-Axis Label:** Accuracy
* **Y-Axis Scale:** 0.5 to 1.0 (increments of 0.1 marked).
* **X-Axis Label:** Target Axis
* **X-Axis Categories (Ordinal/Categorical):** LR, PC1, PC2, PC4, PC8, PC32, PC128, PC512.
* **Legend Location:** Bottom-left quadrant of the plot area.
### Legend Data (Model Identification)
The legend contains six entries, categorized by model family (Llama and Qwen) and parameter size.
| Color | Label | Model Family | Size |
| :--- | :--- | :--- | :--- |
| Dark Red/Maroon | `llama3.1_8b` | Llama 3.1 | 8B |
| Medium Red/Coral | `llama3.2_3b` | Llama 3.2 | 3B |
| Light Peach/Pink | `llama3.2_1b` | Llama 3.2 | 1B |
| Dark Blue/Navy | `qwen2.5_7b` | Qwen 2.5 | 7B |
| Medium Blue | `qwen2.5_3b` | Qwen 2.5 | 3B |
| Light Blue | `qwen2.5_1.5b` | Qwen 2.5 | 1.5B |
---
## 3. Trend Verification and Data Extraction
### General Trend Analysis
All models follow a similar performance trajectory:
1. **Stability (LR to PC8):** High accuracy (approx. 0.93 - 0.99) with minimal degradation.
2. **Initial Decline (PC8 to PC32):** A noticeable downward slope begins.
3. **Sharp Degradation (PC32 to PC512):** All lines slope steeply downward, indicating a significant loss in accuracy as the Target Axis value increases.
### Estimated Data Points (Accuracy)
| Target Axis | llama3.1_8b | llama3.2_3b | llama3.2_1b | qwen2.5_7b | qwen2.5_3b | qwen2.5_1.5b |
| :--- | :---: | :---: | :---: | :---: | :---: | :---: |
| **LR** | ~0.97 | ~0.97 | ~0.93 | ~0.99 | ~0.99 | ~0.99 |
| **PC1** | ~0.96 | ~0.96 | ~0.96 | ~0.95 | ~0.95 | ~0.96 |
| **PC2** | ~0.96 | ~0.96 | ~0.96 | ~0.95 | ~0.95 | ~0.96 |
| **PC4** | ~0.95 | ~0.95 | ~0.95 | ~0.94 | ~0.94 | ~0.94 |
| **PC8** | ~0.94 | ~0.94 | ~0.94 | ~0.93 | ~0.93 | ~0.93 |
| **PC32** | ~0.89 | ~0.89 | ~0.89 | ~0.88 | ~0.88 | ~0.89 |
| **PC128** | ~0.80 | ~0.81 | ~0.79 | ~0.82 | ~0.83 | ~0.84 |
| **PC512** | ~0.66 | ~0.68 | ~0.60 | ~0.76 | ~0.77 | ~0.77 |
---
## 4. Key Observations and Findings
* **Top Performers at Low Complexity:** At the "LR" (Linear Regression/Baseline) stage, the **Qwen 2.5** family (all sizes) outperforms the Llama family, starting near 1.0 accuracy.
* **Convergence:** Between PC1 and PC32, all models perform very similarly, with their lines overlapping significantly in the 0.88 - 0.96 range.
* **Robustness at High Complexity:** As the Target Axis reaches **PC512**, the **Qwen 2.5** models (Blue lines) demonstrate significantly higher robustness than the Llama models.
* The Qwen models maintain an accuracy of ~0.76 - 0.77.
* The Llama models drop more sharply, with `llama3.2_1b` (Light Peach) falling to the lowest point on the chart (~0.60).
* **Size vs. Performance:** Interestingly, within the Qwen family at PC512, the smaller models (`1.5b` and `3b`) appear to hold a very slight edge or parity with the `7b` model, suggesting the architecture's scaling for this specific task is highly efficient.