## Heatmap: Cross-Dataset Performance Transfer Matrix
### Overview
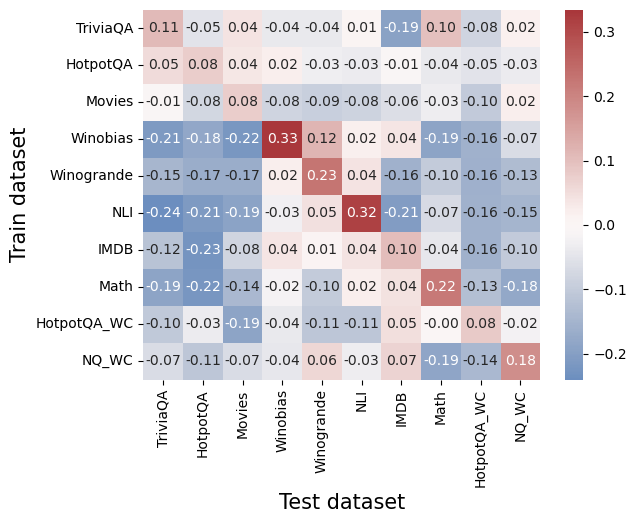
This image is a heatmap visualizing the performance transfer between different machine learning datasets. It shows how models trained on one dataset (rows) perform when tested on another dataset (columns). The values represent a performance metric (likely accuracy difference or transfer score), with positive values (red) indicating positive transfer and negative values (blue) indicating negative transfer or performance degradation.
### Components/Axes
* **Chart Type:** Heatmap (Confusion Matrix style)
* **Y-Axis (Vertical):** Labeled "Train dataset". Lists 10 datasets used for training models.
* **X-Axis (Horizontal):** Labeled "Test dataset". Lists the same 10 datasets used for testing.
* **Color Scale/Legend:** A vertical color bar is positioned on the **right side** of the chart. It maps numerical values to colors:
* **Dark Red:** ~0.3 (Highest positive value)
* **Light Red/Pink:** ~0.1 to 0.2
* **White/Very Light Gray:** ~0.0
* **Light Blue:** ~-0.1
* **Dark Blue:** ~-0.2 (Lowest negative value)
* **Data Labels:** Each cell in the 10x10 grid contains a numerical value, printed in black text.
### Detailed Analysis
**List of Train Datasets (Y-axis, top to bottom):**
1. TriviaQA
2. HotpotQA
3. Movies
4. Winobias
5. Winogrande
6. NLI
7. IMDB
8. Math
9. HotpotQA_WC
10. NQ_WC
**List of Test Datasets (X-axis, left to right):**
1. TriviaQA
2. HotpotQA
3. Movies
4. Winobias
5. Winogrande
6. NLI
7. IMDB
8. Math
9. HotpotQA_WC
10. NQ_WC
**Complete Data Grid (Train Dataset -> Test Dataset: Value):**
* **TriviaQA ->:** TriviaQA: 0.11, HotpotQA: -0.05, Movies: 0.04, Winobias: -0.04, Winogrande: -0.04, NLI: 0.01, IMDB: -0.19, Math: 0.10, HotpotQA_WC: -0.08, NQ_WC: 0.02
* **HotpotQA ->:** TriviaQA: -0.05, HotpotQA: 0.08, Movies: 0.04, Winobias: 0.02, Winogrande: -0.03, NLI: -0.03, IMDB: -0.01, Math: -0.04, HotpotQA_WC: -0.05, NQ_WC: -0.03
* **Movies ->:** TriviaQA: -0.01, HotpotQA: -0.08, Movies: 0.08, Winobias: -0.08, Winogrande: -0.09, NLI: -0.08, IMDB: -0.06, Math: -0.03, HotpotQA_WC: -0.10, NQ_WC: 0.02
* **Winobias ->:** TriviaQA: -0.21, HotpotQA: -0.18, Movies: -0.22, Winobias: 0.33, Winogrande: 0.12, NLI: 0.02, IMDB: 0.04, Math: -0.19, HotpotQA_WC: -0.16, NQ_WC: -0.07
* **Winogrande ->:** TriviaQA: -0.15, HotpotQA: -0.17, Movies: -0.17, Winobias: 0.02, Winogrande: 0.23, NLI: 0.04, IMDB: -0.16, Math: -0.10, HotpotQA_WC: -0.16, NQ_WC: -0.13
* **NLI ->:** TriviaQA: -0.24, HotpotQA: -0.21, Movies: -0.19, Winobias: -0.03, Winogrande: 0.05, NLI: 0.32, IMDB: -0.21, Math: -0.07, HotpotQA_WC: -0.16, NQ_WC: -0.15
* **IMDB ->:** TriviaQA: -0.12, HotpotQA: -0.23, Movies: -0.08, Winobias: 0.04, Winogrande: 0.01, NLI: 0.04, IMDB: 0.10, Math: -0.04, HotpotQA_WC: -0.16, NQ_WC: -0.10
* **Math ->:** TriviaQA: -0.19, HotpotQA: -0.22, Movies: -0.14, Winobias: -0.02, Winogrande: -0.10, NLI: 0.02, IMDB: 0.04, Math: 0.22, HotpotQA_WC: -0.13, NQ_WC: -0.18
* **HotpotQA_WC ->:** TriviaQA: -0.10, HotpotQA: -0.03, Movies: -0.19, Winobias: -0.04, Winogrande: -0.11, NLI: -0.11, IMDB: 0.05, Math: -0.00, HotpotQA_WC: 0.08, NQ_WC: -0.02
* **NQ_WC ->:** TriviaQA: -0.07, HotpotQA: -0.11, Movies: -0.07, Winobias: -0.04, Winogrande: 0.06, NLI: -0.03, IMDB: 0.07, Math: -0.19, HotpotQA_WC: -0.14, NQ_WC: 0.18
### Key Observations
1. **Strong Diagonal Performance:** The highest values in the matrix are consistently found along the main diagonal (where Train dataset = Test dataset). This includes Winobias (0.33), NLI (0.32), Winogrande (0.23), Math (0.22), and TriviaQA (0.11). This indicates models perform best when tested on the same domain they were trained on.
2. **Significant Negative Transfer:** Many off-diagonal cells show strong negative values (dark blue), particularly when models trained on one dataset are tested on a seemingly unrelated one. For example:
* NLI-trained model on TriviaQA test: -0.24
* IMDB-trained model on HotpotQA test: -0.23
* Math-trained model on HotpotQA test: -0.22
3. **Positive Transfer Clusters:** Some related datasets show positive off-diagonal transfer:
* Winobias -> Winogrande: 0.12 (both are coreference resolution tasks).
* Winogrande -> Winobias: 0.02 (weaker, but still positive).
* NQ_WC -> NQ_WC (diagonal): 0.18, and it shows slight positive transfer to IMDB (0.07) and Winogrande (0.06).
4. **Neutral or Weak Transfer:** The "Movies" dataset row and column show mostly weak, slightly negative values, suggesting it neither benefits from nor strongly harms performance on other tasks, except for its own diagonal (0.08).
### Interpretation
This heatmap provides a quantitative map of **task relatedness and negative transfer** in machine learning. The data suggests:
1. **Domain Specificity is Dominant:** The strong diagonal confirms that models are highly specialized. Training on a specific dataset (e.g., NLI for natural language inference) yields the best results on that exact task, but this expertise does not generalize well—and often hurts performance—on other tasks.
2. **Negative Transfer is a Major Challenge:** The prevalence of blue cells indicates that naively applying a model trained on one task to another can be actively detrimental. This is a critical consideration for real-world AI deployment, where a model might encounter out-of-domain data.
3. **Task Taxonomy Can Be Inferred:** The pattern of positive off-diagonal values helps cluster tasks. Winobias and Winogrande (both reasoning/commonsense tasks) show some mutual positive transfer. Question-answering datasets (TriviaQA, HotpotQA, NQ_WC) show mixed but generally weak relationships with each other.
4. **Outlier - NLI:** The NLI (Natural Language Inference) dataset shows the strongest diagonal (0.32) and the most severe negative transfer to other tasks (e.g., -0.24 to TriviaQA). This suggests NLI learning creates a very distinct, specialized model representation that is highly incompatible with other types of language understanding tasks.
**In essence, the chart argues against the notion of a single, general-purpose language model trained on a mix of tasks. Instead, it visualizes the "balkanization" of model performance, where expertise in one area often comes at the cost of performance in another.**