## Bar Chart: Error and Non-response by Dataset and Model
### Overview
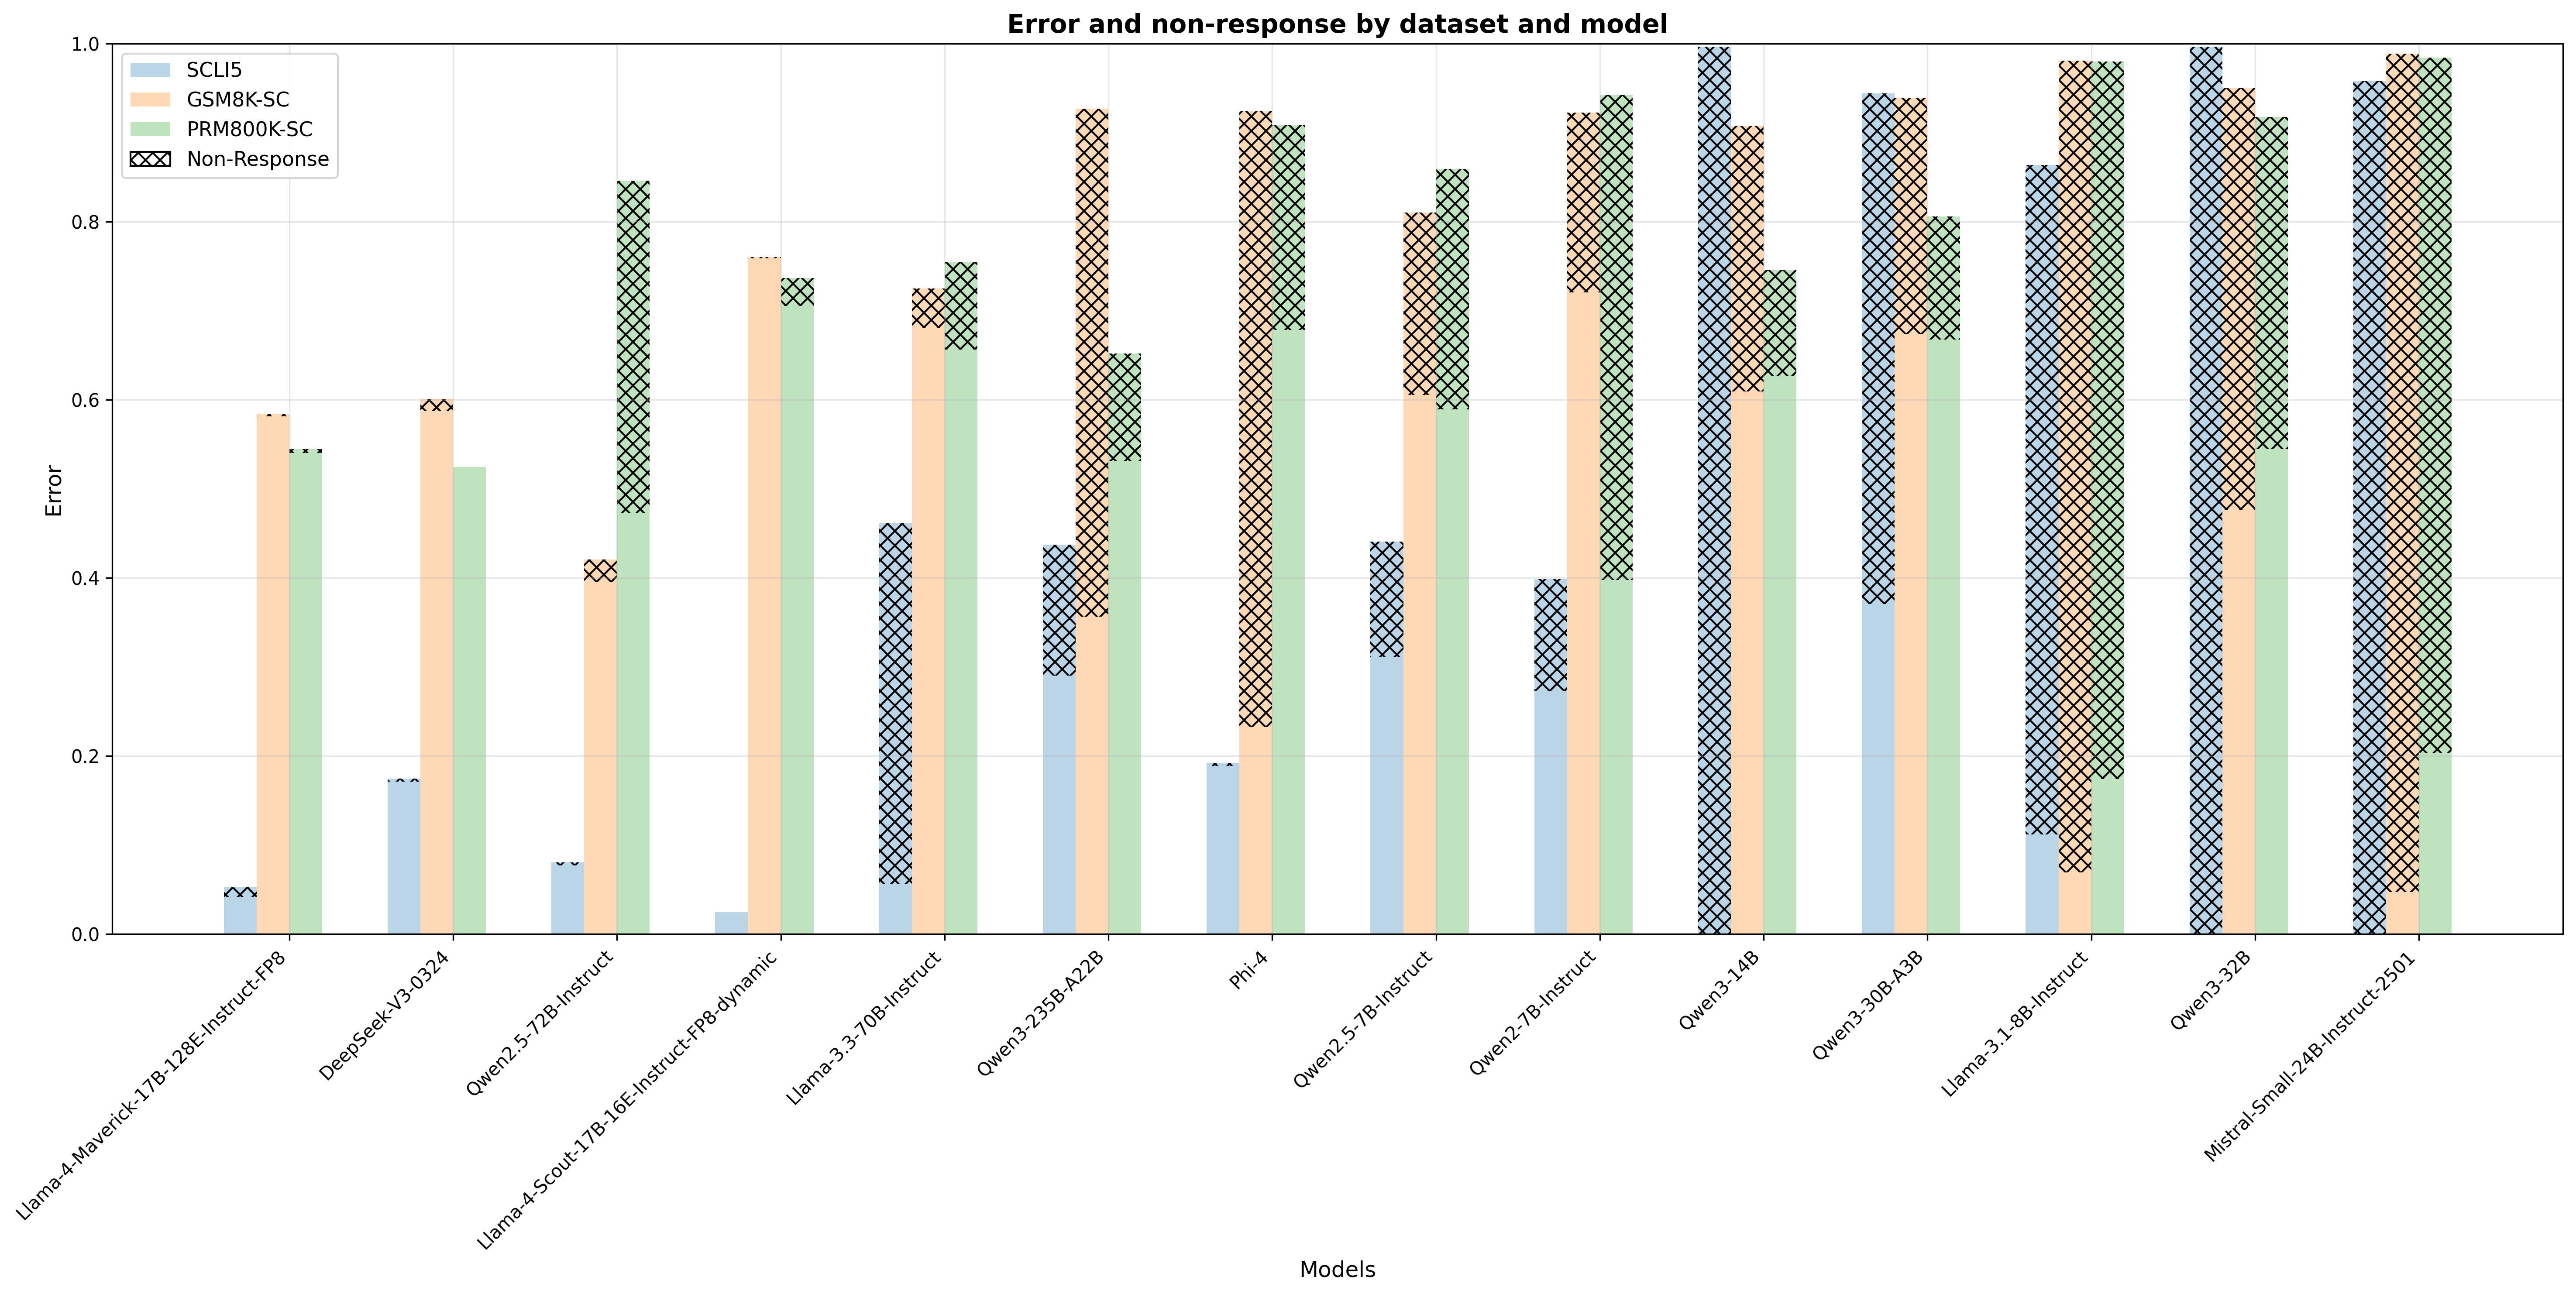
This bar chart visualizes the error rate and non-response rate for different models across several datasets. The chart uses stacked bars to represent the contribution of each dataset (SCLF, GSM8K-SC, and PRM800K-SC) to the total error, with the non-response rate displayed as a separate pattern on top of the stacked bars. The x-axis represents the models, and the y-axis represents the error rate (ranging from 0 to 1).
### Components/Axes
* **Title:** "Error and non-response by dataset and model" (Top-center)
* **X-axis Label:** "Models" (Bottom-center)
* **Y-axis Label:** "Error" (Left-center)
* **Y-axis Scale:** 0 to 1, with increments of 0.2.
* **Legend:** Located at the top-right corner.
* SCLF (Yellow)
* GSM8K-SC (Light Blue)
* PRM800K-SC (Light Grey)
* Non-Response (Cross-hatched pattern)
* **Models (X-axis labels):**
* Llama-7B-Instruct-v0.9
* Deepspeak/y0324
* OpenLLM-2.5-2B-Instruct
* Llama-Scroll-7B-1.6E-Instruct-FP8-dynamic
* Llama-3-70B-Instruct
* Open-3.25B-A2B
* Phi-4
* Open-3.5-7B-Instruct
* Open-3.5-7B-Instruct
* Open-3-14B
* Open-3-30B-AIB
* Llama-3-1.8B-Instruct
* Open-3-32B
* Mistral-Small-34B-Instruct-v301
### Detailed Analysis
The chart consists of 14 models, each represented by a stacked bar. The height of each segment within the bar corresponds to the error rate for a specific dataset. The cross-hatched portion on top of each bar represents the non-response rate.
Here's a breakdown of the approximate values for each model, based on visual estimation:
* **Llama-7B-Instruct-v0.9:** SCLF ~ 0.05, GSM8K-SC ~ 0.15, PRM800K-SC ~ 0.35, Non-Response ~ 0.05. Total Error ~ 0.6
* **Deepspeak/y0324:** SCLF ~ 0.05, GSM8K-SC ~ 0.15, PRM800K-SC ~ 0.35, Non-Response ~ 0.05. Total Error ~ 0.6
* **OpenLLM-2.5-2B-Instruct:** SCLF ~ 0.05, GSM8K-SC ~ 0.1, PRM800K-SC ~ 0.2, Non-Response ~ 0.1. Total Error ~ 0.45
* **Llama-Scroll-7B-1.6E-Instruct-FP8-dynamic:** SCLF ~ 0.1, GSM8K-SC ~ 0.2, PRM800K-SC ~ 0.4, Non-Response ~ 0.1. Total Error ~ 0.8
* **Llama-3-70B-Instruct:** SCLF ~ 0.1, GSM8K-SC ~ 0.15, PRM800K-SC ~ 0.5, Non-Response ~ 0.1. Total Error ~ 0.85
* **Open-3.25B-A2B:** SCLF ~ 0.15, GSM8K-SC ~ 0.2, PRM800K-SC ~ 0.5, Non-Response ~ 0.1. Total Error ~ 0.95
* **Phi-4:** SCLF ~ 0.05, GSM8K-SC ~ 0.05, PRM800K-SC ~ 0.15, Non-Response ~ 0.05. Total Error ~ 0.3
* **Open-3.5-7B-Instruct (first instance):** SCLF ~ 0.05, GSM8K-SC ~ 0.1, PRM800K-SC ~ 0.2, Non-Response ~ 0.1. Total Error ~ 0.45
* **Open-3.5-7B-Instruct (second instance):** SCLF ~ 0.05, GSM8K-SC ~ 0.1, PRM800K-SC ~ 0.2, Non-Response ~ 0.1. Total Error ~ 0.45
* **Open-3-14B:** SCLF ~ 0.1, GSM8K-SC ~ 0.15, PRM800K-SC ~ 0.4, Non-Response ~ 0.1. Total Error ~ 0.75
* **Open-3-30B-AIB:** SCLF ~ 0.1, GSM8K-SC ~ 0.15, PRM800K-SC ~ 0.4, Non-Response ~ 0.1. Total Error ~ 0.75
* **Llama-3-1.8B-Instruct:** SCLF ~ 0.1, GSM8K-SC ~ 0.15, PRM800K-SC ~ 0.3, Non-Response ~ 0.1. Total Error ~ 0.65
* **Open-3-32B:** SCLF ~ 0.1, GSM8K-SC ~ 0.15, PRM800K-SC ~ 0.4, Non-Response ~ 0.1. Total Error ~ 0.75
* **Mistral-Small-34B-Instruct-v301:** SCLF ~ 0.05, GSM8K-SC ~ 0.1, PRM800K-SC ~ 0.2, Non-Response ~ 0.1. Total Error ~ 0.45
**Trends:**
* The PRM800K-SC dataset consistently contributes the largest portion to the overall error rate across most models.
* Non-response rates are relatively consistent across models, generally ranging from 0.05 to 0.1.
* Open-3.25B-A2B exhibits the highest total error rate, primarily driven by the PRM800K-SC dataset.
* Phi-4 exhibits the lowest total error rate.
### Key Observations
* The models Llama-7B-Instruct-v0.9 and Deepspeak/y0324 have identical error profiles.
* The two instances of Open-3.5-7B-Instruct have identical error profiles.
* The error rates for Open-3-14B, Open-3-30B-AIB, and Open-3-32B are very similar.
### Interpretation
The chart demonstrates the performance of various language models on three different datasets, measured by error rate and non-response rate. The dominance of the PRM800K-SC dataset in contributing to the overall error suggests that this dataset presents the greatest challenge for these models. The relatively consistent non-response rates indicate that the models are equally likely to fail to provide a response regardless of the dataset. The significant variation in total error rates between models highlights the importance of model selection for specific tasks. The models with lower error rates (e.g., Phi-4, Mistral-Small-34B-Instruct-v301) may be more suitable for applications where accuracy is critical. The identical profiles of some models suggest they may be based on the same underlying architecture or training data. Further investigation would be needed to understand the specific reasons for these performance differences and to identify strategies for improving model performance on the PRM800K-SC dataset.