## Line Graph: Compute Density (TFLOPs/mm²) vs. K
### Overview
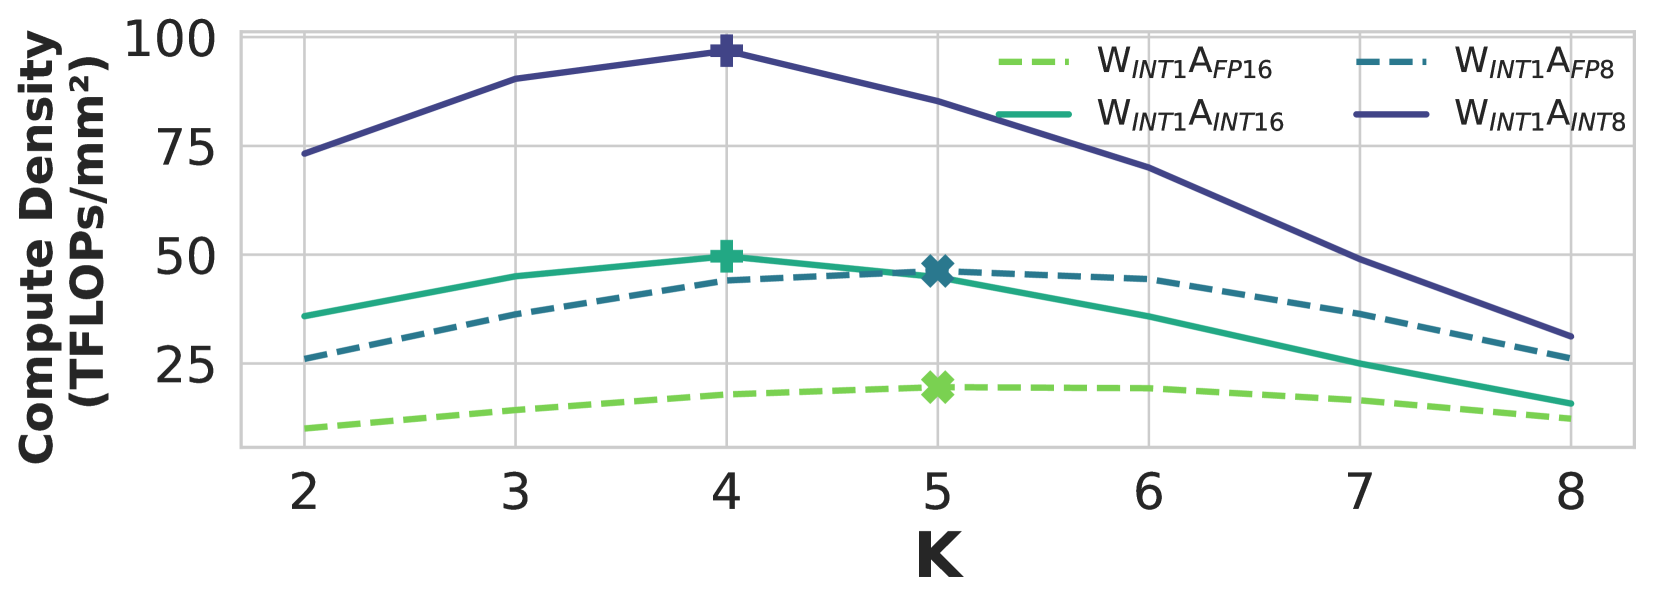
The graph depicts four data series representing compute density (TFLOPs/mm²) across values of K (2–8). Each series corresponds to a combination of weight precision (INT1) and activation precision (FP16, FP8, INT16, INT8). The y-axis ranges from 0 to 100, while the x-axis spans K=2 to K=8.
### Components/Axes
- **X-axis (K)**: Integer values 2–8, labeled "K".
- **Y-axis (Compute Density)**: TFLOPs/mm², labeled "Compute Density (TFLOPs/mm²)".
- **Legend**: Positioned in the top-right corner, mapping colors to data series:
- **Green dashed**: `W_INT1A_FP16`
- **Blue dashed**: `W_INT1A_FP8`
- **Solid green**: `W_INT1A_INT16`
- **Solid blue**: `W_INT1A_INT8`
### Detailed Analysis
1. **W_INT1A_FP16 (Green dashed)**:
- Starts at ~10 TFLOPs/mm² at K=2.
- Peaks at ~20 TFLOPs/mm² at K=5.
- Declines to ~15 TFLOPs/mm² at K=8.
- Trend: Gradual increase until K=5, then gradual decline.
2. **W_INT1A_FP8 (Blue dashed)**:
- Starts at ~30 TFLOPs/mm² at K=2.
- Peaks at ~50 TFLOPs/mm² at K=5.
- Declines to ~40 TFLOPs/mm² at K=8.
- Trend: Sharp rise until K=5, then gradual decline.
3. **W_INT1A_INT16 (Solid green)**:
- Starts at ~20 TFLOPs/mm² at K=2.
- Peaks at ~50 TFLOPs/mm² at K=4.
- Declines to ~30 TFLOPs/mm² at K=8.
- Trend: Sharp rise until K=4, then gradual decline.
4. **W_INT1A_INT8 (Solid blue)**:
- Starts at ~70 TFLOPs/mm² at K=2.
- Peaks at ~100 TFLOPs/mm² at K=4.
- Declines to ~50 TFLOPs/mm² at K=8.
- Trend: Sharp rise until K=4, then steep decline.
### Key Observations
- **Highest Peak**: `W_INT1A_INT8` (solid blue) achieves the maximum compute density (~100 TFLOPs/mm²) at K=4.
- **Lowest Values**: `W_INT1A_FP16` (green dashed) consistently has the lowest compute density across all K values.
- **Divergence at K=4**: All series peak at K=4 except `W_INT1A_FP16`, which peaks later at K=5.
- **Steep Declines**: `W_INT1A_INT8` and `W_INT1A_INT16` show the sharpest declines post-K=4.
### Interpretation
The data suggests that higher precision (INT8/INT16) correlates with greater compute density at lower K values, but performance degrades sharply as K increases. Lower precision (FP16/FP8) maintains more stable but lower compute densities. The peak at K=4 for INT8/INT16 may indicate an optimal configuration for this metric, while FP16/FP8 configurations lag significantly. The divergence in trends highlights trade-offs between precision and scalability across K values.