## Line Chart: Drive Level for Knowledge Acquisition and Expression Over Time
### Overview
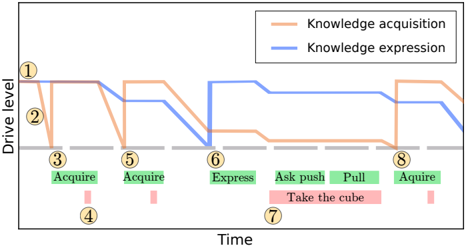
This image is a schematic line chart illustrating the fluctuating "Drive level" for two cognitive processes—Knowledge Acquisition and Knowledge Expression—over a conceptual timeline. The chart uses annotated time points and action labels to correlate specific events with changes in drive levels. It appears to be a theoretical model or diagram from a cognitive science, psychology, or AI research context.
### Components/Axes
* **Y-Axis (Vertical):** Labeled **"Drive level"**. It has three marked levels indicated by circled numbers: **①** (highest), **②** (middle), and **③** (lowest). A dashed grey line runs horizontally at level ③, serving as a baseline.
* **X-Axis (Horizontal):** Labeled **"Time"**. It is marked with eight circled numbers **① through ⑧**, representing sequential time points or events.
* **Legend:** Located in the top-right corner.
* **Orange Line:** Labeled **"Knowledge acquisition"**.
* **Blue Line:** Labeled **"Knowledge expression"**.
* **Action Labels:** Positioned below the X-axis, aligned with specific time points. They are color-coded:
* **Green Boxes:** Contain action verbs. From left to right: **"Acquire"** (under point ③), **"Acquire"** (under point ⑤), **"Express"** (under point ⑥), **"Ask push"**, **"Pull"**, and **"Aquire"** (note: likely a typo for "Acquire") (all under point ⑧).
* **Pink Boxes:** Contain a specific action. **"Take the cube"** is positioned under point ⑦.
* **Numbered Annotations:** Circled numbers **① through ⑧** are placed directly on the chart lines or near key inflection points, corresponding to the time points on the X-axis.
### Detailed Analysis
**Trend Verification & Data Point Extraction:**
* **Knowledge Acquisition (Orange Line):**
* **Trend:** Starts at a high drive level (①), experiences sharp drops and recoveries, and generally maintains a higher average drive than expression until the later stages.
* **Key Points:**
* At **Time ①**: Drive is at its peak (level ①).
* **Time ①-③**: Sharp decline to the baseline (level ③), coinciding with the first **"Acquire"** action.
* **Time ③-⑤**: Recovers to a high level, then dips again before the second **"Acquire"** action at Time ⑤.
* **Time ⑤-⑥**: Drops to a mid-level (between ② and ③).
* **Time ⑥-⑧**: Remains relatively stable at a mid-to-low level, with a final rise after the **"Aquire"** action at Time ⑧.
* **Knowledge Expression (Blue Line):**
* **Trend:** Starts at a moderate level, shows a significant, sustained drop in the middle, followed by a strong recovery and a final decline.
* **Key Points:**
* At **Time ①**: Drive starts at a moderate level (around ②).
* **Time ①-⑥**: Experiences a gradual decline, followed by a very sharp drop to the baseline (level ③) at **Time ⑥**, which aligns with the **"Express"** action.
* **Time ⑥-⑦**: Recovers sharply to a high level (near ①).
* **Time ⑦-⑧**: Plateaus, then begins a final decline after the actions at Time ⑧.
**Spatial Grounding of Elements:**
* The **legend** is in the **top-right** quadrant.
* The **"Take the cube"** label (pink) is **centered below** the X-axis between points ⑦ and ⑧.
* The **green action labels** are aligned **directly below** their corresponding time point markers on the X-axis.
### Key Observations
1. **Inverse Relationship at Critical Points:** At **Time ⑥**, the drive for Expression crashes to its minimum precisely as the "Express" action occurs, while Acquisition drive is in a stable, lower state. This suggests a resource trade-off or a sequential process where expression consumes the drive built by acquisition.
2. **Action-Driven Fluctuations:** The sharpest changes in drive levels (both drops and recoveries) are tightly correlated with the labeled actions ("Acquire," "Express"). This implies the model posits actions as direct triggers for drive state changes.
3. **Final Convergence:** By **Time ⑧**, both drives are at moderate-to-low levels, but the Acquisition drive shows an upward tick following the final "Aquire" action, while Expression drive is trending downward.
4. **Asymmetry:** The "Knowledge expression" line has a more dramatic single drop and recovery, while the "Knowledge acquisition" line shows more frequent, jagged fluctuations.
### Interpretation
This chart models a dynamic system where the motivational "drive" to acquire knowledge and to express it are separate but interacting variables. The data suggests several underlying principles:
* **Phased Process:** Knowledge processing may occur in phases. High acquisition drive (early phase) builds a reservoir, which is then drawn upon for expression (middle phase), leading to a depletion of expression drive. The system then resets or recharges.
* **Cost of Expression:** The dramatic drop in expression drive at the moment of expression (Time ⑥) indicates that the act of expressing knowledge is cognitively costly or depleting in this model.
* **Goal-Directed Behavior:** The numbered events and specific actions ("Take the cube") frame this as a goal-oriented sequence. The drive levels are not random but are responses to task demands within a structured activity.
* **Potential Application:** This could be a framework for understanding learning cycles, human-computer interaction in tutoring systems, or the internal state management of an AI agent designed to both learn and communicate. The "Take the cube" action might represent a physical or metaphorical object manipulation that bridges acquisition and expression phases.
**Note on Language & Precision:** All text in the image is in English. The chart is schematic; the Y-axis "Drive level" has no numerical scale, so values are described relative to the marked levels ①, ②, and ③. The analysis is based on the visual relationships and trends presented.