\n
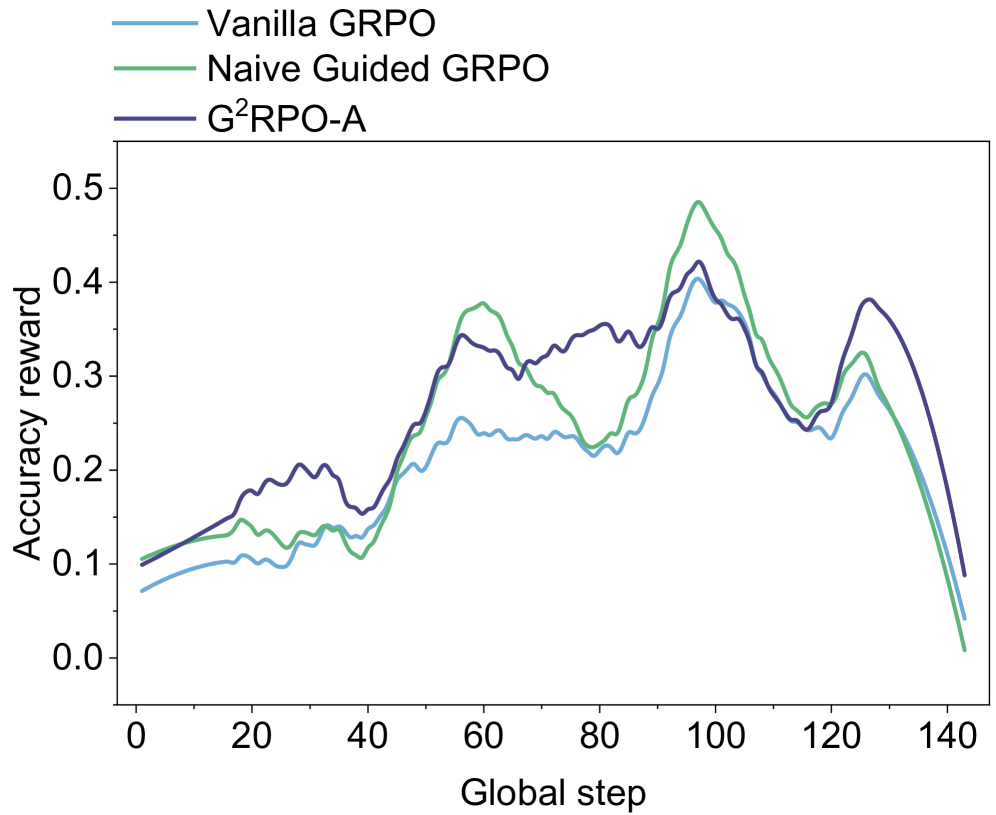
## Line Chart: Accuracy Reward vs. Global Step
### Overview
This image presents a line chart comparing the accuracy reward of three different algorithms – Vanilla GRPO, Naive Guided GRPO, and G²RPO-A – over a series of global steps. The chart visualizes the performance of each algorithm as it progresses, allowing for a comparison of their learning curves.
### Components/Axes
* **X-axis:** "Global step" ranging from 0 to 140, with tick marks at intervals of 20.
* **Y-axis:** "Accuracy reward" ranging from 0.0 to 0.5, with tick marks at intervals of 0.1.
* **Legend:** Located in the top-left corner, identifying the three data series:
* Vanilla GRPO (Light Blue)
* Naive Guided GRPO (Green)
* G²RPO-A (Dark Blue)
### Detailed Analysis
The chart displays three lines representing the accuracy reward for each algorithm over the global steps.
* **Vanilla GRPO (Light Blue):** The line starts at approximately 0.08 at step 0. It generally slopes upward, reaching a peak of around 0.36 at step 90. After step 90, the line declines, ending at approximately 0.05 at step 140. There are some fluctuations, with a dip around step 40 to approximately 0.16.
* **Naive Guided GRPO (Green):** This line begins at approximately 0.11 at step 0. It exhibits a more pronounced upward trend than Vanilla GRPO, peaking at around 0.42 at step 100. Following the peak, the line declines sharply, reaching approximately 0.03 at step 140.
* **G²RPO-A (Dark Blue):** The line starts at approximately 0.09 at step 0. It shows a steady increase, reaching a peak of around 0.38 at step 60, then fluctuates between 0.30 and 0.40 until step 100. After step 100, the line declines, ending at approximately 0.10 at step 140.
### Key Observations
* Naive Guided GRPO consistently outperforms Vanilla GRPO and G²RPO-A for the majority of the global steps, achieving the highest accuracy reward.
* All three algorithms exhibit a similar trend: an initial increase in accuracy reward followed by a decline after reaching a peak.
* The decline in accuracy reward is most pronounced for Naive Guided GRPO, suggesting potential overfitting or instability.
* G²RPO-A demonstrates a more stable performance compared to the other two algorithms, with less fluctuation after the initial increase.
### Interpretation
The data suggests that Naive Guided GRPO is the most effective algorithm for improving accuracy reward in the initial stages of training. However, its performance deteriorates significantly after reaching a peak, indicating a potential issue with generalization or long-term stability. Vanilla GRPO and G²RPO-A exhibit more moderate performance, with G²RPO-A showing greater stability. The decline in accuracy reward for all algorithms after a certain point could be attributed to factors such as diminishing returns, overfitting, or the exploration of less rewarding states. The chart highlights the trade-off between initial performance and long-term stability in these algorithms. Further investigation is needed to understand the reasons behind the decline in accuracy reward and to explore strategies for improving the generalization capabilities of Naive Guided GRPO.