\n
## Scatter Plot: Sociology - Confidence vs. Target Length
### Overview
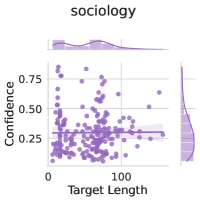
The image presents a scatter plot visualizing the relationship between "Target Length" and "Confidence" for the category "sociology". A density plot is overlaid on top of the scatter points, and a regression line is fitted to the data. The plot suggests a weak or non-existent linear relationship between the two variables.
### Components/Axes
* **Title:** "sociology" (positioned at the top-center)
* **X-axis:** "Target Length" (ranging from approximately 0 to 150)
* **Y-axis:** "Confidence" (ranging from approximately 0 to 0.8)
* **Data Points:** Numerous purple dots representing individual data points.
* **Density Plot:** A shaded purple area representing the density distribution of the data.
* **Regression Line:** A dark purple line representing the linear regression fit.
* **Shaded Area around Regression Line:** A lighter purple shaded area representing the confidence interval around the regression line.
### Detailed Analysis
The scatter plot shows a wide dispersion of points.
* **Data Point Distribution:** The majority of data points cluster between "Target Length" values of 0 and 100, with "Confidence" values generally below 0.6. There are fewer points with "Target Length" values above 100.
* **Regression Line Trend:** The regression line is nearly horizontal, indicating a very slight negative slope. This suggests that as "Target Length" increases, "Confidence" tends to decrease very slightly.
* **Density Plot Trend:** The density plot shows a peak in density around a "Target Length" of 0-50 and a "Confidence" of 0.2-0.4. The density decreases as "Target Length" increases.
* **Approximate Data Points (sampled):**
* Target Length = 0, Confidence ≈ 0.25
* Target Length = 25, Confidence ≈ 0.55
* Target Length = 50, Confidence ≈ 0.40
* Target Length = 75, Confidence ≈ 0.30
* Target Length = 100, Confidence ≈ 0.20
* Target Length = 125, Confidence ≈ 0.55
* Target Length = 150, Confidence ≈ 0.25
### Key Observations
* The scatter plot exhibits a high degree of scatter, indicating a weak correlation between "Target Length" and "Confidence".
* The regression line is almost flat, reinforcing the observation of a weak relationship.
* The density plot shows a concentration of data points at lower "Target Length" values.
* There are no obvious outliers that significantly deviate from the general trend.
### Interpretation
The data suggests that "Target Length" is not a strong predictor of "Confidence" within the "sociology" category. The near-horizontal regression line indicates that changes in "Target Length" have minimal impact on "Confidence". The high scatter suggests that other factors likely play a more significant role in determining "Confidence". The concentration of data points at lower "Target Length" values might indicate a preference for shorter targets or a limitation in the range of target lengths considered within this dataset. The confidence interval around the regression line is relatively narrow, suggesting some consistency in the lack of a strong relationship. This could be a result of the model being unable to find a significant pattern in the data, or it could indicate that the true relationship is indeed very weak.