\n
## Dual-Axis Line Chart: Training Metrics Over Steps
### Overview
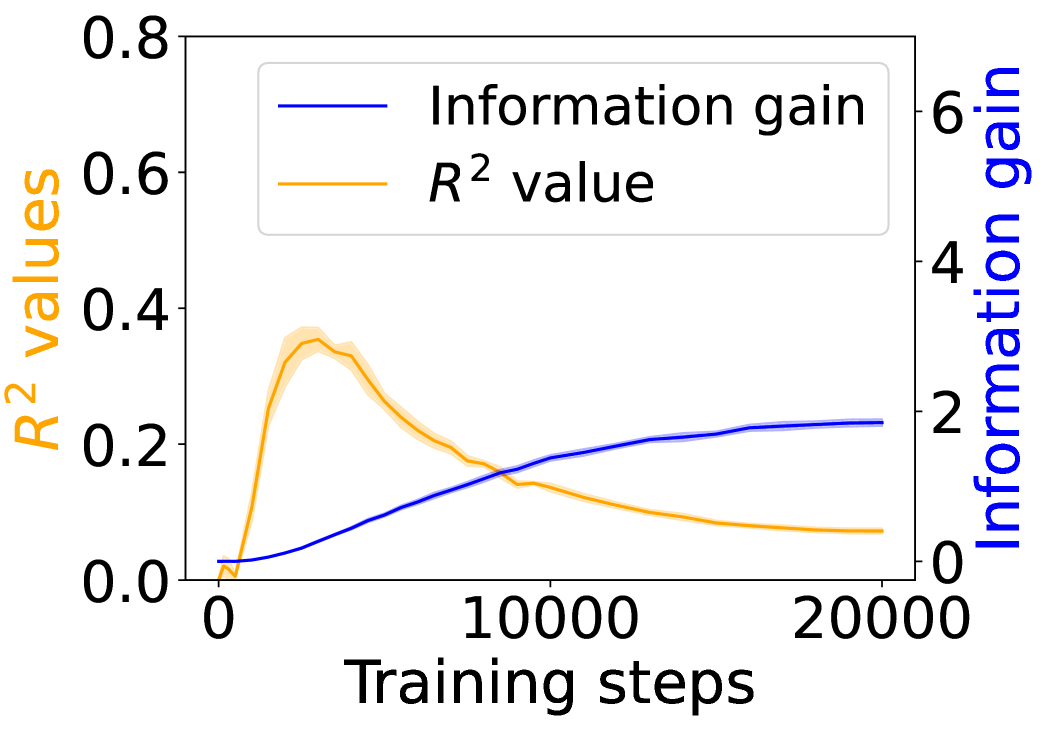
The image is a dual-axis line chart plotting two distinct metrics against training steps. The chart compares the progression of "Information gain" and "R² value" over the course of 20,000 training steps. The visual suggests an inverse relationship between the two metrics after an initial phase.
### Components/Axes
* **X-Axis (Bottom):** Labeled "Training steps". The scale runs from 0 to 20,000, with major tick marks at 0, 10,000, and 20,000.
* **Primary Y-Axis (Left):** Labeled "R² values" in orange text. The scale runs from 0.0 to 0.8, with major tick marks at 0.0, 0.2, 0.4, 0.6, and 0.8.
* **Secondary Y-Axis (Right):** Labeled "Information gain" in blue text. The scale runs from 0 to 6, with major tick marks at 0, 2, 4, and 6.
* **Legend:** Positioned in the top-right quadrant of the chart area. It contains two entries:
* A blue line labeled "Information gain".
* An orange line labeled "R² value".
* **Data Series:**
1. **Information gain (Blue Line):** A solid blue line plotted against the right y-axis.
2. **R² value (Orange Line):** A solid orange line plotted against the left y-axis. This line is accompanied by a semi-transparent orange shaded region, likely indicating variance, standard deviation, or a confidence interval around the mean value.
### Detailed Analysis
**1. Information Gain (Blue Line - Right Axis):**
* **Trend:** The line shows a consistent, monotonic upward trend that gradually decelerates.
* **Data Points (Approximate):**
* Starts near 0 at step 0.
* Reaches ~0.5 by step 5,000.
* Reaches ~1.5 by step 10,000.
* Reaches ~2.0 by step 15,000.
* Plateaus near ~2.1 by step 20,000.
**2. R² Value (Orange Line - Left Axis):**
* **Trend:** The line shows a sharp initial increase to a peak, followed by a steady decline.
* **Data Points (Approximate):**
* Starts near 0.0 at step 0.
* Rises sharply to a peak of approximately 0.35 between steps 2,500 and 3,000.
* Begins a steady decline after the peak.
* Crosses below the Information gain line (in terms of visual position on the chart) around step 9,000.
* Continues to decline, reaching approximately 0.1 by step 15,000.
* Ends at approximately 0.08 by step 20,000.
* **Shaded Region:** The orange shaded area is widest around the peak (steps 2,000-4,000), suggesting higher variance or uncertainty in the R² measurement during the period of maximum performance. The band narrows as the value declines.
### Key Observations
1. **Inverse Relationship Post-Peak:** After approximately step 3,000, the two metrics move in opposite directions. Information gain continues to increase, while the R² value decreases.
2. **Divergent End States:** By the end of training (20,000 steps), Information gain has plateaued at a relatively high value (~2.1), while the R² value has degraded to a low value (~0.08), significantly below its peak.
3. **Peak Performance Window:** The model's performance, as measured by R², is optimal in a narrow early window (steps ~2,000-4,000). Continued training beyond this point harms this specific metric.
4. **Uncertainty Correlates with Performance:** The variance (shaded region) in the R² metric is highest when the metric itself is at its peak.
### Interpretation
This chart illustrates a classic trade-off or potential overfitting dynamic in a machine learning training process.
* **What the data suggests:** The "Information gain" metric (likely measuring the model's learning or reduction in uncertainty) improves steadily and saturates, indicating the model continues to learn from the data throughout training. However, the "R² value" (a measure of goodness-of-fit, often on a validation set) peaks early and then deteriorates. This divergence implies that while the model is still extracting information, it is becoming progressively worse at generalizing that information to the specific task measured by R². The model may be starting to memorize noise or idiosyncrasies of the training data after step ~3,000.
* **Relationship between elements:** The two axes and their corresponding lines are directly compared on the same temporal (step) scale. The crossing of the lines around step 9,000 is a visual artifact of the dual-axis scaling but highlights the point where the numerical value of Information gain surpasses the numerical value of R².
* **Notable Anomaly:** The most critical observation is the **decline in R² after step 3,000**. This is not an anomaly in the data collection but a significant behavioral trend of the model. It suggests that for the objective measured by R², **early stopping** around step 3,000 would have yielded a much better model than training to completion at 20,000 steps. The continued increase in Information gain may represent the model learning features that are not useful, or even detrimental, for the R² objective.