## Line Graph: Training Steps vs. R² and Information Gain
### Overview
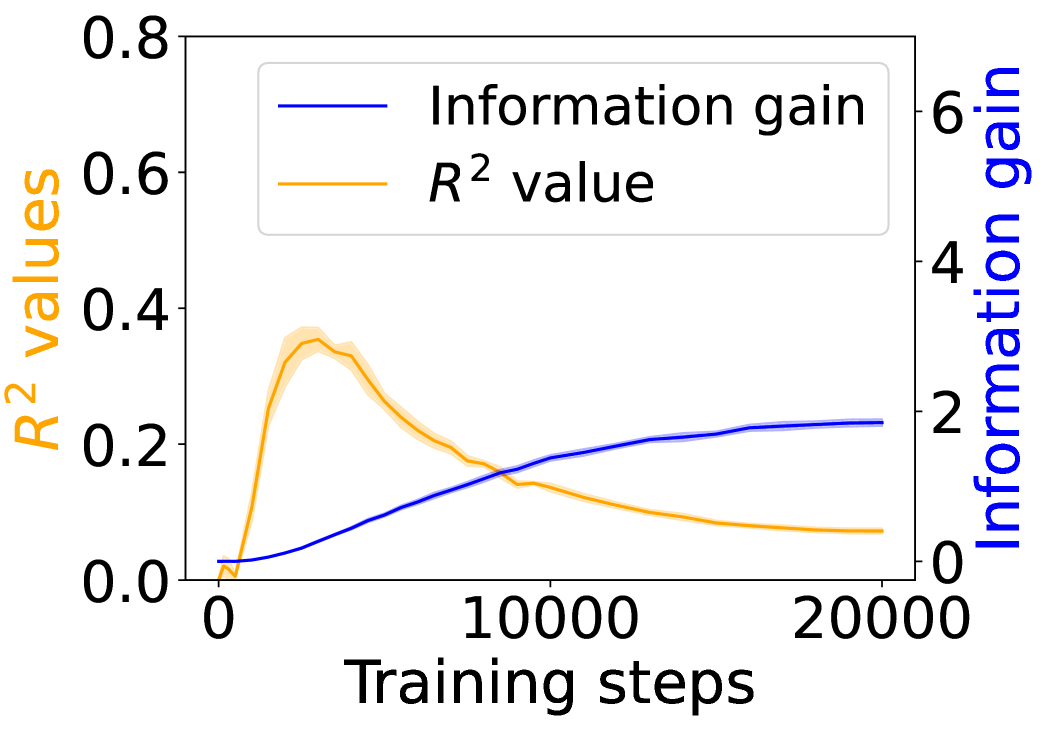
The image depicts a dual-axis line graph comparing two metrics across training steps: **R² values** (left y-axis) and **Information gain** (right y-axis). The x-axis represents training steps from 0 to 20,000. Two lines are plotted: a blue line for Information gain and an orange line for R² values. The legend is positioned in the top-left corner.
---
### Components/Axes
- **X-axis**: "Training steps" (0 to 20,000, linear scale).
- **Left Y-axis**: "R² values" (0 to 0.8, linear scale).
- **Right Y-axis**: "Information gain" (0 to 6, linear scale).
- **Legend**:
- Blue line: "Information gain"
- Orange line: "R² value"
- **Secondary Axis**: Right y-axis for Information gain (blue line).
---
### Detailed Analysis
1. **R² Values (Orange Line)**:
- Starts near 0 at 0 training steps.
- Peaks at ~0.35 around 5,000 steps.
- Declines steadily to ~0.05 by 20,000 steps.
- Shaded region (confidence interval) widens slightly after 5,000 steps.
2. **Information Gain (Blue Line)**:
- Starts at 0 at 0 training steps.
- Increases monotonically, reaching ~2.5 by 20,000 steps.
- Slope flattens slightly after ~15,000 steps.
3. **Intersection Point**:
- The two lines cross near 10,000 steps, where R² ≈ 0.2 and Information gain ≈ 2.
---
### Key Observations
- **R² Divergence**: The orange line peaks early and then declines, suggesting diminishing returns in model performance (as measured by R²) after ~5,000 steps.
- **Information Gain Growth**: The blue line shows sustained improvement, indicating continued learning or feature relevance even as R² plateaus.
- **Metric Discrepancy**: R² and Information gain diverge significantly after 10,000 steps, highlighting potential limitations of R² for this task.
---
### Interpretation
- **Training Dynamics**: The graph suggests that while R² initially improves with training, it eventually degrades, possibly due to overfitting or noise in the data. In contrast, Information gain continues to rise, implying the model is still capturing meaningful patterns.
- **Metric Selection**: The divergence between R² and Information gain raises questions about the suitability of R² as a sole evaluation metric. Information gain may better reflect long-term learning in this context.
- **Anomaly**: The sharp peak in R² at 5,000 steps could indicate a temporary overfit or a specific feature alignment that later becomes irrelevant.
---
### Spatial Grounding
- **Legend**: Top-left corner, clearly associating colors with metrics.
- **Secondary Axis**: Right y-axis for Information gain, avoiding overlap with R² values.
- **Line Placement**: Blue (Information gain) consistently above orange (R²) after 10,000 steps.
---
### Content Details
- **R² Values**:
- Peak: ~0.35 (5,000 steps).
- Final Value: ~0.05 (20,000 steps).
- **Information Gain**:
- Final Value: ~2.5 (20,000 steps).
- Slope: ~0.000125 per step (linear approximation).
---
### Key Observations (Reiterated)
- R² values decline after 5,000 steps, while Information gain continues to rise.
- The two metrics cross at ~10,000 steps, signaling a shift in model behavior.
- Information gain’s sustained growth suggests it is a more reliable metric for this task.