\n
## Scatter Plot: t-SNE of synthetic tools by Category
### Overview
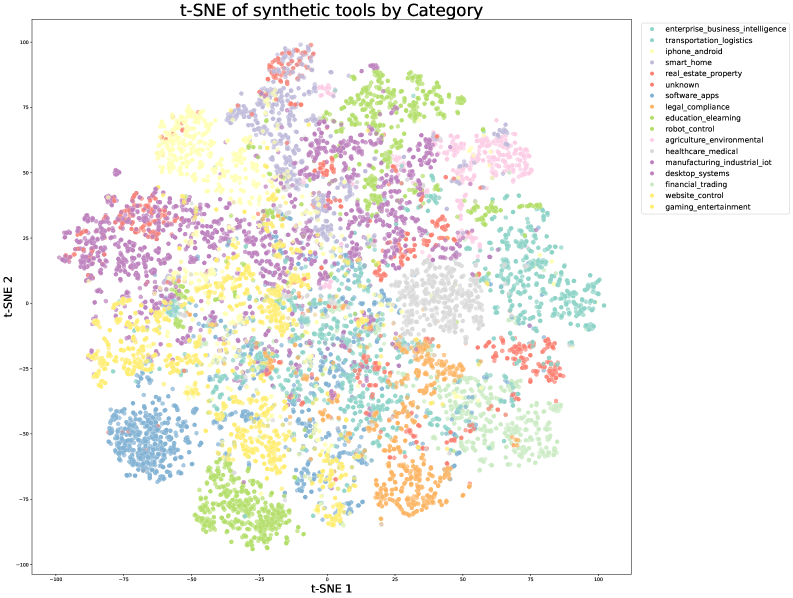
This image presents a scatter plot generated using t-distributed Stochastic Neighbor Embedding (t-SNE). The plot visualizes the distribution of synthetic tools across two principal components, t-SNE 1 and t-SNE 2, and color-codes the points based on their category. The plot aims to reveal clusters and relationships between different categories of synthetic tools.
### Components/Axes
* **Title:** "t-SNE of synthetic tools by Category" (top-center)
* **X-axis:** "t-SNE 1" (bottom-center), ranging approximately from -100 to 100.
* **Y-axis:** "t-SNE 2" (left-center), ranging approximately from -75 to 100.
* **Legend:** Located in the top-right corner, listing the following categories with corresponding colors:
* enterprise\_business\_intelligence (light blue)
* transportation\_logistics (dark blue)
* iphone\_android (purple)
* smart\_home (red)
* real\_estate\_property (orange)
* unknown (grey)
* software\_apps (light green)
* legal\_compliance (dark green)
* education\_elearning (teal)
* robot\_control (yellow)
* agriculture\_environmental (brown)
* healthcare\_medical (pink)
* manufacturing\_industrial\_iot (light purple)
* desktop\_systems (cyan)
* financial\_trading (magenta)
* website\_control (olive)
* gaming\_entertainment (dark red)
### Detailed Analysis
The scatter plot shows a complex distribution of points, with several discernible clusters.
* **Enterprise\_business\_intelligence (light blue):** Forms a relatively tight cluster in the bottom-left quadrant, centered around t-SNE 1 = -50 and t-SNE 2 = -50.
* **Transportation\_logistics (dark blue):** Located adjacent to the enterprise cluster, slightly more dispersed, with a center around t-SNE 1 = -30 and t-SNE 2 = -40.
* **Iphone\_android (purple):** Occupies a large area in the center-left, extending from t-SNE 1 = -40 to t-SNE 1 = 20, and t-SNE 2 = -20 to 50.
* **Smart\_home (red):** Forms a distinct cluster in the top-right quadrant, centered around t-SNE 1 = 60 and t-SNE 2 = 70.
* **Real\_estate\_property (orange):** Located below the smart home cluster, around t-SNE 1 = 40 and t-SNE 2 = 30.
* **Unknown (grey):** Scattered throughout the plot, with a higher concentration in the center.
* **Software\_apps (light green):** Forms a cluster in the bottom-right quadrant, around t-SNE 1 = 40 and t-SNE 2 = -60.
* **Legal\_compliance (dark green):** Located near the software apps cluster, slightly more dispersed.
* **Education\_elearning (teal):** Forms a cluster around t-SNE 1 = -20 and t-SNE 2 = 30.
* **Robot\_control (yellow):** Located in the center of the plot, with a concentration around t-SNE 1 = 0 and t-SNE 2 = 0.
* **Agriculture\_environmental (brown):** Forms a cluster around t-SNE 1 = 20 and t-SNE 2 = -20.
* **Healthcare\_medical (pink):** Located near the agriculture cluster, slightly more dispersed.
* **Manufacturing\_industrial\_iot (light purple):** Forms a cluster around t-SNE 1 = -10 and t-SNE 2 = 50.
* **Desktop\_systems (cyan):** Located in the bottom-left quadrant, near the enterprise cluster.
* **Financial\_trading (magenta):** Forms a cluster around t-SNE 1 = 50 and t-SNE 2 = 0.
* **Website\_control (olive):** Located near the financial trading cluster, slightly more dispersed.
* **Gaming\_entertainment (dark red):** Forms a cluster in the top-left quadrant, around t-SNE 1 = -20 and t-SNE 2 = 80.
### Key Observations
* The "smart\_home" category is well-separated from most other categories, indicating a distinct feature space.
* The "enterprise\_business\_intelligence" and "transportation\_logistics" categories are closely clustered, suggesting similarities in their underlying characteristics.
* The "unknown" category is widely dispersed, indicating a lack of clear patterns or features.
* The "iphone\_android" category occupies a large area, suggesting a diverse range of tools within this category.
### Interpretation
The t-SNE plot effectively visualizes the relationships between different categories of synthetic tools. The clustering suggests that tools within the same category share similar characteristics, as captured by the t-SNE algorithm. The separation between clusters indicates distinct feature spaces, while the dispersion within clusters reflects the diversity of tools within each category. The "unknown" category's dispersion suggests that these tools lack clear defining features or are outliers.
The plot demonstrates the utility of dimensionality reduction techniques like t-SNE for exploring high-dimensional data and identifying underlying patterns. This visualization can be valuable for understanding the landscape of synthetic tools and identifying potential areas for further investigation or development. The relative positioning of clusters can also inform decisions about tool selection or integration. The plot suggests that the synthetic tools can be broadly categorized based on their underlying characteristics, and that further analysis could focus on understanding the specific features that differentiate these categories.