\n
## Bar Chart: Fraction vs. Average Accuracy for Critical and Random Tokens
### Overview
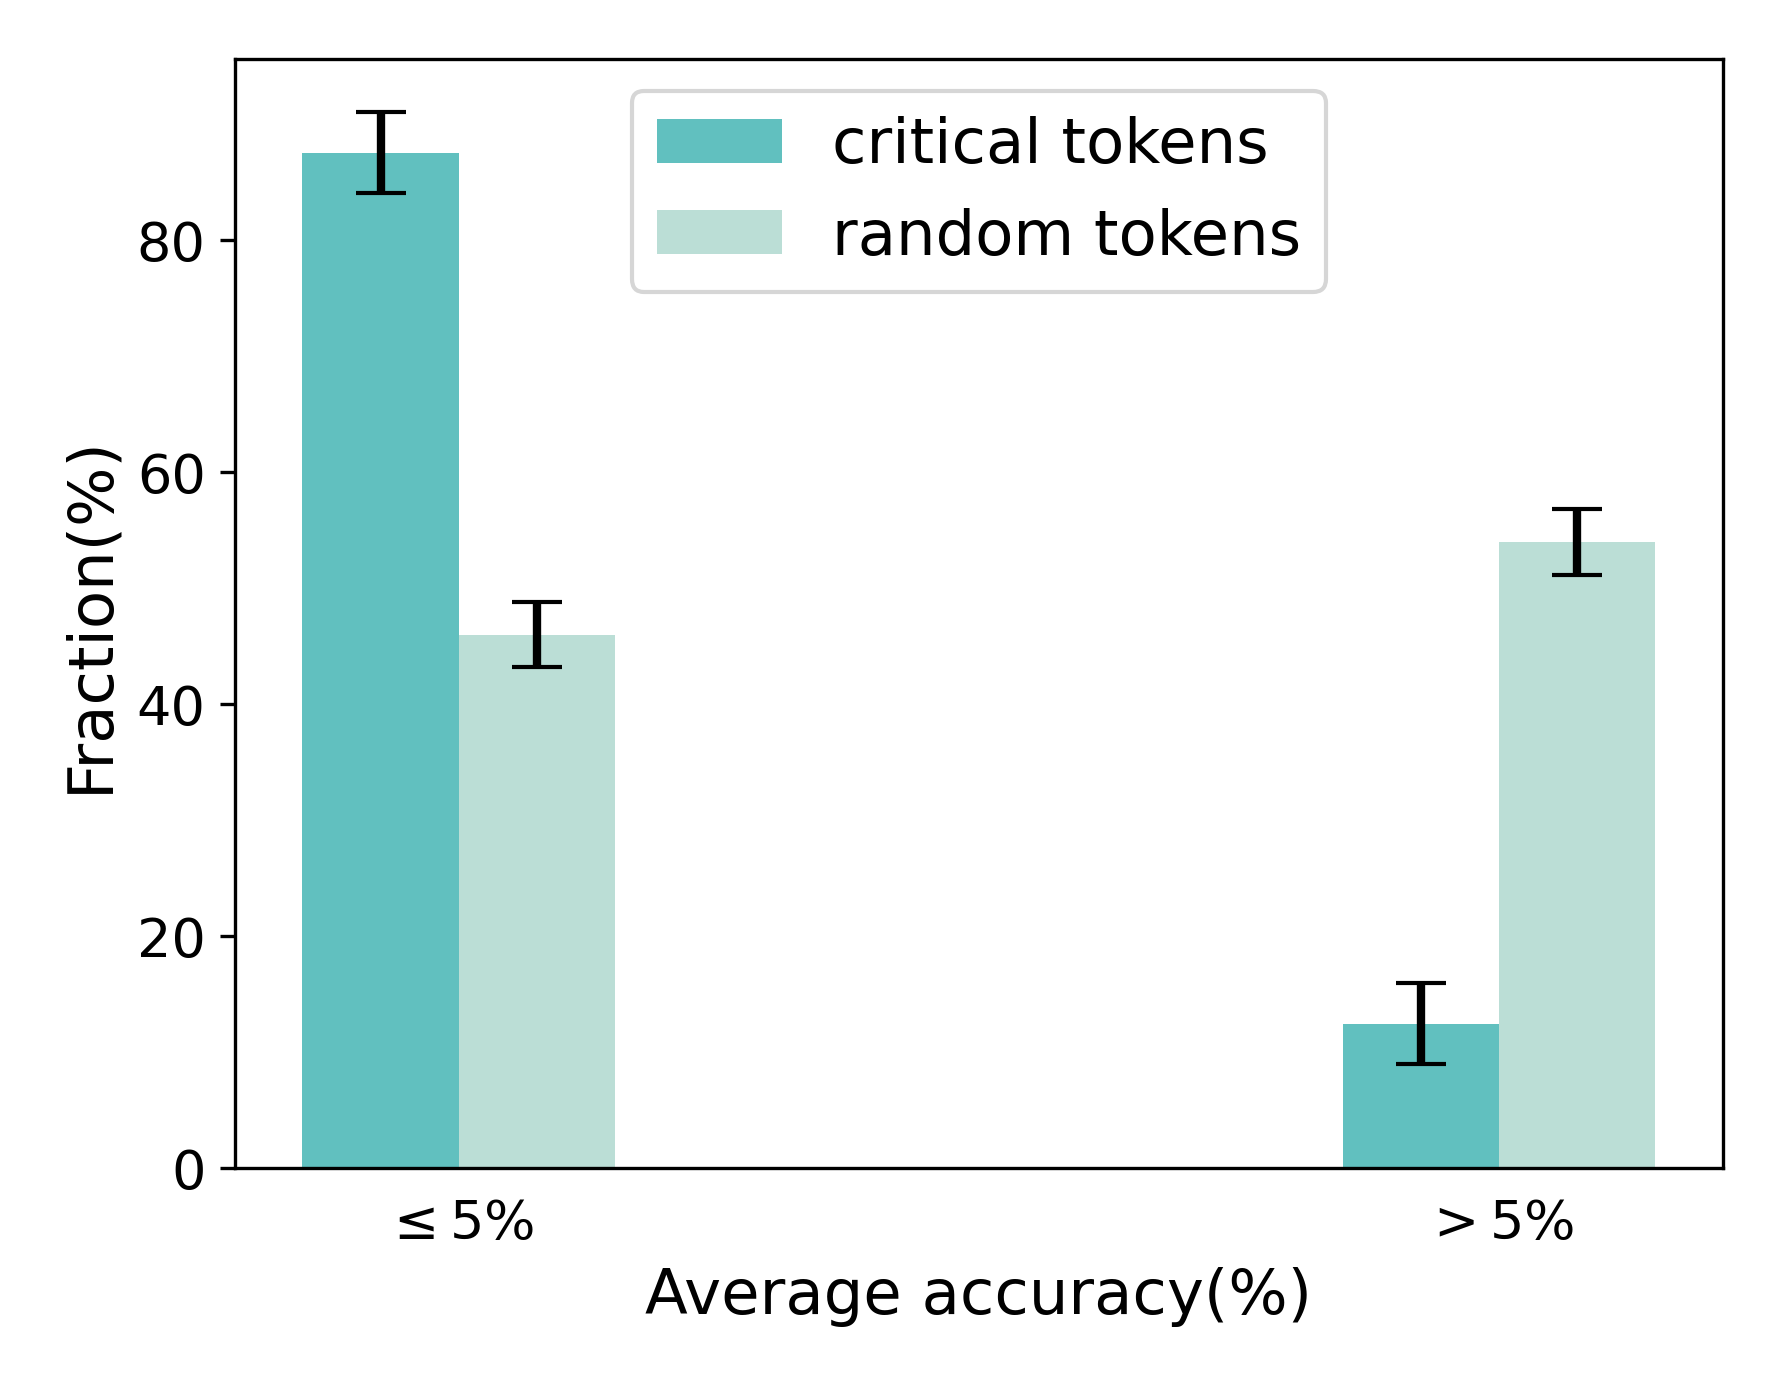
This bar chart compares the fraction of tokens (expressed as a percentage) for "critical tokens" and "random tokens" based on their average accuracy (also expressed as a percentage). The chart displays two groups of bars, one for tokens with average accuracy less than or equal to 5% and another for tokens with average accuracy greater than 5%. Error bars are included for each bar, indicating the variability or uncertainty in the fraction values.
### Components/Axes
* **X-axis:** "Average accuracy (%)" with two categories: "≤ 5%" and "> 5%".
* **Y-axis:** "Fraction (%)" ranging from 0 to 90.
* **Legend:** Located in the top-right corner, distinguishing between "critical tokens" (represented by a teal color) and "random tokens" (represented by a light green color).
* **Bars:** Represent the fraction of tokens for each accuracy category and token type.
* **Error Bars:** Vertical lines extending above and below each bar, indicating the standard error or confidence interval.
### Detailed Analysis
The chart presents data for two groups of tokens, categorized by their average accuracy: ≤ 5% and > 5%. For each accuracy category, the fraction of "critical tokens" and "random tokens" is displayed.
**≤ 5% Average Accuracy:**
* **Critical Tokens:** The bar is teal and reaches approximately 84% on the Y-axis. The error bar extends from approximately 78% to 90%.
* **Random Tokens:** The bar is light green and reaches approximately 47% on the Y-axis. The error bar extends from approximately 40% to 54%.
**> 5% Average Accuracy:**
* **Critical Tokens:** The bar is teal and reaches approximately 13% on the Y-axis. The error bar extends from approximately 8% to 18%.
* **Random Tokens:** The bar is light green and reaches approximately 53% on the Y-axis. The error bar extends from approximately 47% to 59%.
### Key Observations
* For tokens with average accuracy ≤ 5%, the fraction of critical tokens is significantly higher than that of random tokens.
* For tokens with average accuracy > 5%, the fraction of random tokens is significantly higher than that of critical tokens.
* The error bars indicate a relatively high degree of variability in the fraction values, particularly for the "critical tokens" with ≤ 5% accuracy.
### Interpretation
The data suggests a strong inverse relationship between average accuracy and the fraction of critical tokens. Critical tokens tend to have lower average accuracy, while random tokens tend to have higher average accuracy. This could indicate that critical tokens are more difficult to predict or classify accurately, potentially due to their inherent complexity or importance in the context. The higher variability in the critical token fractions might suggest that the factors influencing their accuracy are more diverse or less predictable.
The chart implies that focusing on improving the accuracy of critical tokens could be a key area for improvement, as they currently exhibit lower performance compared to random tokens. The difference in fractions between the two accuracy categories suggests that the impact of token type on accuracy is substantial. The error bars, while indicating variability, do not overlap between the critical and random token groups within each accuracy category, suggesting that the observed differences are statistically significant.