## Bar Chart: Fraction of Critical vs. Random Tokens by Average Accuracy
### Overview
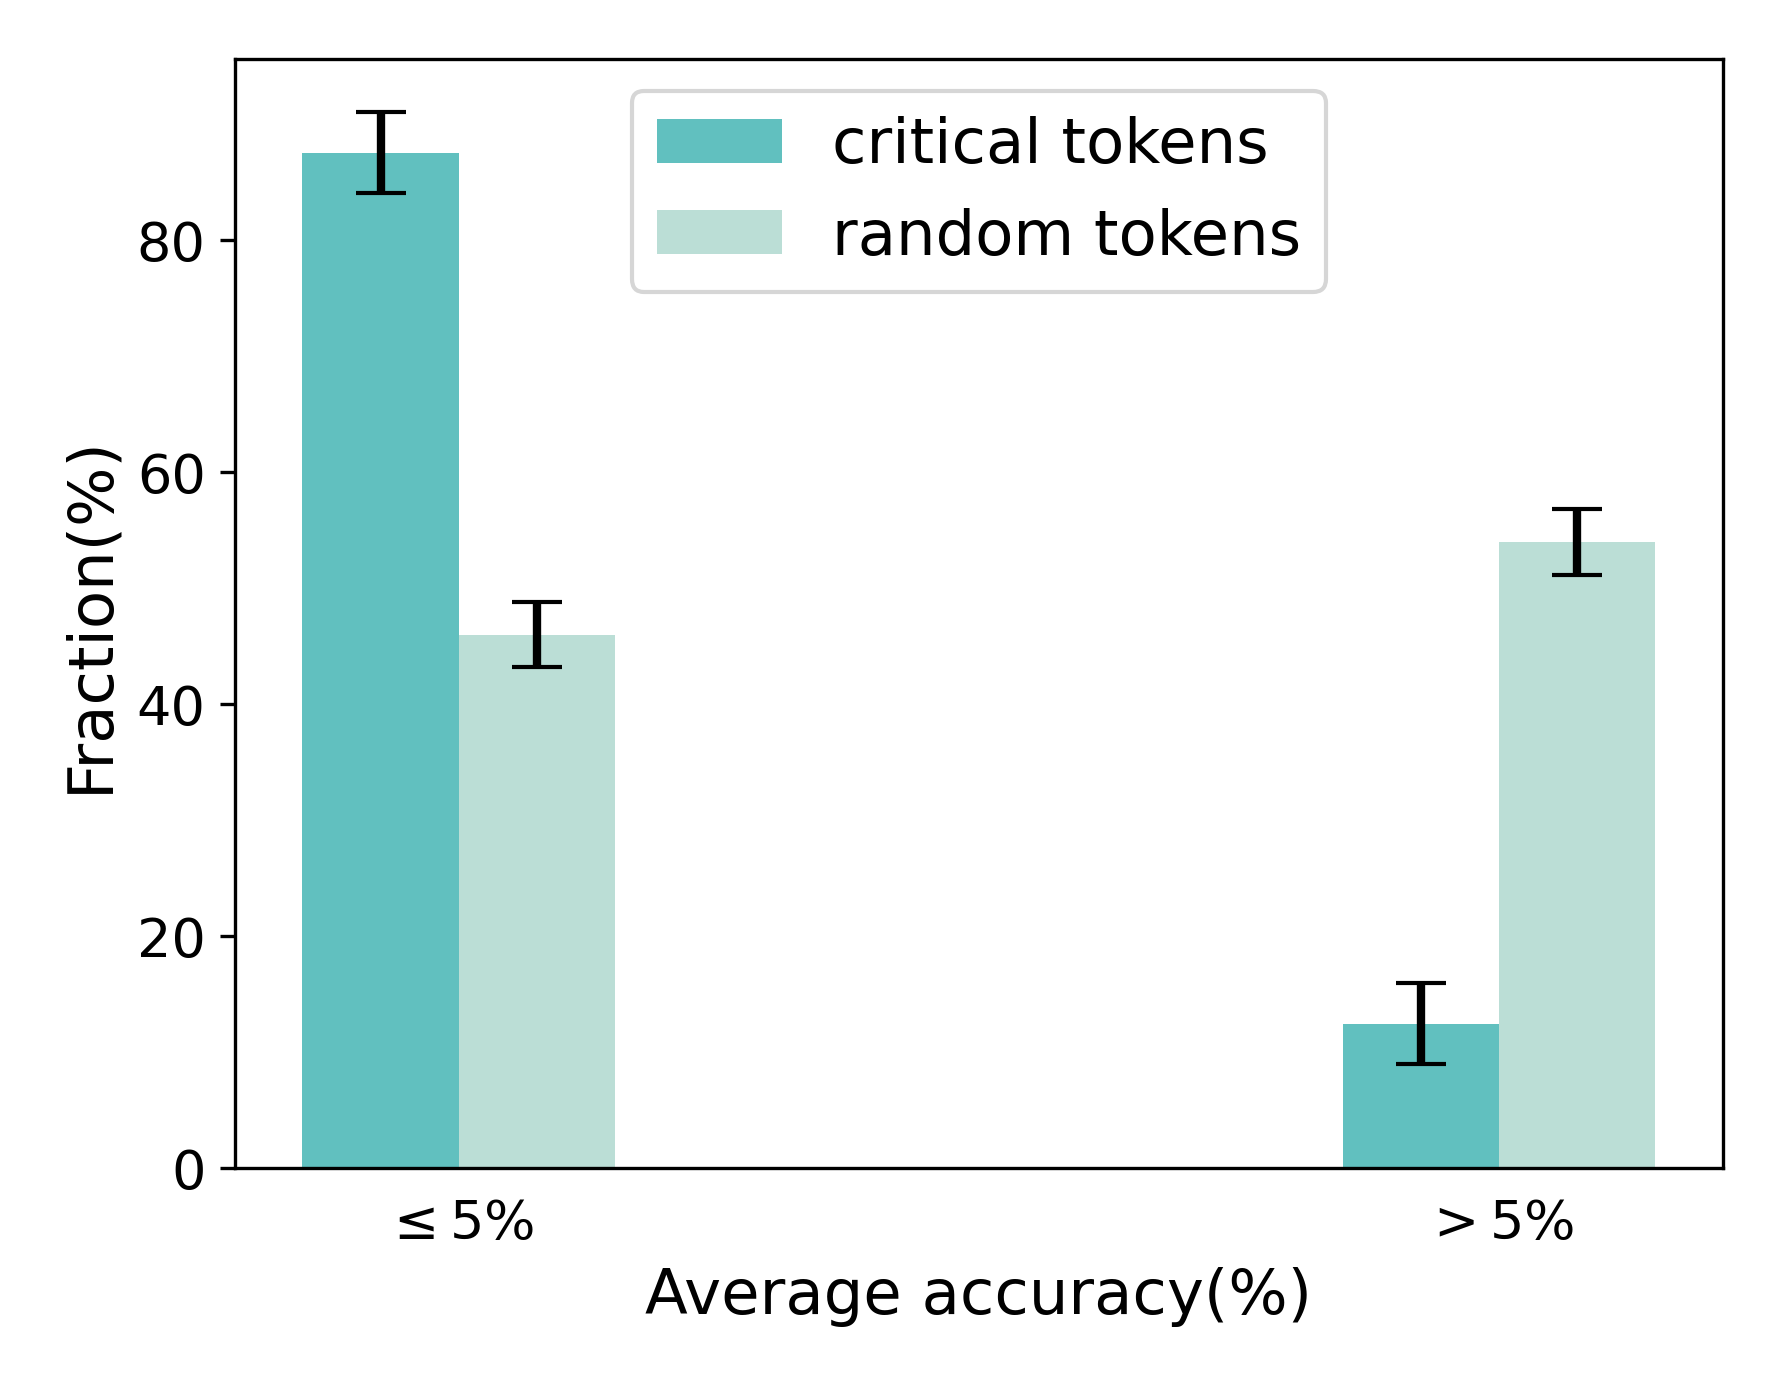
The chart compares the fraction (%) of critical tokens and random tokens across two average accuracy ranges: ≤5% and >5%. Critical tokens are represented by teal bars, while random tokens use light teal bars. Error bars indicate measurement uncertainty.
### Components/Axes
- **X-axis**: "Average accuracy(%)" with two categories:
- ≤5% (left)
- >5% (right)
- **Y-axis**: "Fraction(%)" ranging from 0 to 100.
- **Legend**:
- Teal: Critical tokens
- Light teal: Random tokens
- **Error bars**: Vertical lines above each bar, indicating ± uncertainty (exact values unspecified).
### Detailed Analysis
1. **≤5% Accuracy**:
- Critical tokens: ~85% (teal bar with error bar).
- Random tokens: ~45% (light teal bar with error bar).
2. **>5% Accuracy**:
- Critical tokens: ~10% (teal bar with error bar).
- Random tokens: ~55% (light teal bar with error bar).
### Key Observations
- Critical tokens dominate at ≤5% accuracy (~85% vs. ~45% for random tokens).
- At >5% accuracy, critical tokens drop sharply (~10%), while random tokens rise (~55%).
- Error bars suggest variability, but no overlap between critical/random token fractions in either category.
### Interpretation
The data demonstrates an inverse relationship between average accuracy and the effectiveness of critical tokens. At low accuracy (≤5%), critical tokens are significantly more prevalent, suggesting they play a critical role in scenarios with poor performance. However, as accuracy improves (>5%), critical tokens become less frequent, while random tokens dominate. This implies that critical tokens may be more impactful in low-accuracy contexts, possibly due to their specificity, whereas random tokens gain relevance in higher-accuracy scenarios where they can contribute more consistently. The stark contrast highlights a potential trade-off between token type and system performance thresholds.