## Diagram: Causal Reasoning Framework
### Overview
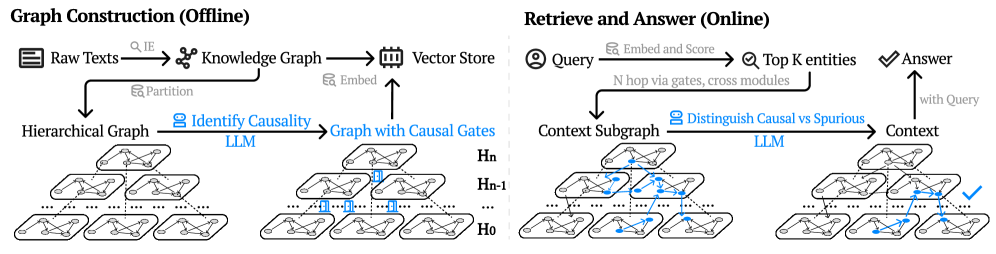
The image presents a diagram illustrating a causal reasoning framework, divided into two main phases: "Graph Construction (Offline)" and "Retrieve and Answer (Online)". The diagram outlines the process of building a knowledge graph from raw texts, identifying causal relationships, and then using this graph to answer queries by distinguishing between causal and spurious connections.
### Components/Axes
**Left Side: Graph Construction (Offline)**
* **Raw Texts:** Represented by an icon of stacked documents.
* **IE (Information Extraction):** A gray label with an arrow pointing from "Raw Texts" to "Knowledge Graph".
* **Knowledge Graph:** Represented by a network icon.
* **Vector Store:** Represented by a database icon.
* **Embed:** A gray label with an arrow pointing from "Knowledge Graph" to "Vector Store".
* **Partition:** A gray label with an arrow pointing from "Raw Texts" to "Hierarchical Graph".
* **Hierarchical Graph:** A multi-layered graph structure.
* **Identify Causality:** A blue label with a person icon, pointing from "Hierarchical Graph" to "Graph with Causal Gates". Labeled "LLM" in blue below.
* **Graph with Causal Gates:** A multi-layered graph structure with some highlighted (blue) connections.
* **Embed:** An arrow pointing from "Graph with Causal Gates" to "Vector Store".
* **Hn, Hn-1, H0:** Labels indicating different layers of the hierarchical graphs.
**Right Side: Retrieve and Answer (Online)**
* **Query:** Represented by a person icon.
* **Embed and Score:** A gray label with an arrow pointing from "Query" to "Top K entities".
* **Top K entities:** Represented by a magnifying glass icon.
* **Answer:** Represented by a checkmark icon.
* **N hop via gates, cross modules:** A black curved arrow pointing from "Query" to "Context Subgraph".
* **Context Subgraph:** A multi-layered graph structure with some highlighted (blue) connections.
* **Distinguish Causal vs Spurious:** A blue label with a robot icon, pointing from "Context Subgraph" to "Context". Labeled "LLM" in blue below.
* **Context:** A multi-layered graph structure with a highlighted (blue) path leading to the "Answer".
* **with Query:** An arrow pointing from "Context" to "Answer".
### Detailed Analysis
**Graph Construction (Offline):**
1. **Raw Texts** are processed using **Information Extraction (IE)** to create a **Knowledge Graph**.
2. The **Knowledge Graph** is embedded into a **Vector Store**.
3. The **Raw Texts** are also partitioned into a **Hierarchical Graph**.
4. **Causality** is identified within the **Hierarchical Graph** using an **LLM (Large Language Model)**, resulting in a **Graph with Causal Gates**.
5. The **Graph with Causal Gates** is embedded into the **Vector Store**.
**Retrieve and Answer (Online):**
1. A **Query** is embedded and scored to identify **Top K entities**.
2. A **Context Subgraph** is extracted from the **Knowledge Graph** based on the **Query**.
3. **Causal** vs. **Spurious** connections are distinguished within the **Context Subgraph** using an **LLM**, resulting in a refined **Context**.
4. The **Context** is used to generate an **Answer** to the **Query**.
### Key Observations
* The diagram highlights the use of Large Language Models (LLMs) in both the offline graph construction and online query answering phases.
* The hierarchical graph structure is used in both phases, suggesting a multi-level representation of knowledge and context.
* The distinction between causal and spurious connections is a key aspect of the framework, ensuring accurate and reliable answers.
### Interpretation
The diagram illustrates a comprehensive framework for causal reasoning, leveraging knowledge graphs and LLMs. The offline phase focuses on building a structured representation of knowledge, while the online phase focuses on retrieving and reasoning about relevant information to answer queries. The use of LLMs to identify causality and distinguish between causal and spurious connections is crucial for ensuring the accuracy and reliability of the answers. The hierarchical graph structure allows for a multi-level representation of knowledge, enabling more nuanced and context-aware reasoning.