## Line Graphs: Age Group Trends in ΔÂ(t) and ΔÂ(t)/ΔÂ60-69(t) (2020-03-31 to 2020-05-21)
### Overview
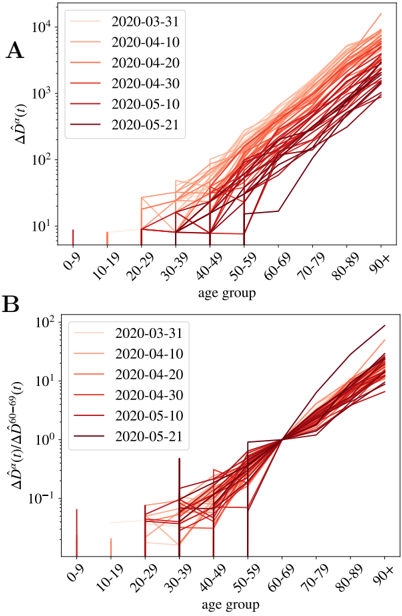
Two line graphs (A and B) depict age-group-specific trends in a metric denoted ΔÂ(t) and its ratio to ΔÂ60-69(t) over six dates in March-May 2020. Both graphs use logarithmic y-axes and show increasing trends with age and time.
### Components/Axes
- **X-axis (both graphs)**: Age groups (0-9, 10-19, ..., 90+), evenly spaced.
- **Y-axis (Graph A)**: ΔÂ(t) (log scale: 10¹ to 10⁴).
- **Y-axis (Graph B)**: ΔÂ(t)/ΔÂ60-69(t) (log scale: 10⁻¹ to 10²).
- **Legends**:
- Left-aligned, with dates (2020-03-31 to 2020-05-21) in shades of red/orange.
- Colors match line colors in graphs (e.g., lightest shade = 2020-03-31, darkest = 2020-05-21).
- **Line styles**: Solid lines for all dates; no markers or error bars visible.
### Detailed Analysis
#### Graph A: ΔÂ(t)
- **Trends**:
- All age groups show upward trends over time.
- Younger groups (0-9, 10-19) have lower values (10¹–10² range).
- Older groups (60-69+) exhibit exponential growth (10³–10⁴ range by 2020-05-21).
- Steepest increases occur in 70-79, 80-89, and 90+ groups.
- **Notable patterns**:
- Lines for later dates (e.g., 2020-05-21) consistently lie above earlier dates.
- Age-group separation widens over time (e.g., 90+ group in 2020-05-21 is ~100x higher than 2020-03-31).
#### Graph B: ΔÂ(t)/ΔÂ60-69(t)
- **Trends**:
- Ratios increase with age (0-9: ~10⁻¹; 90+: ~10² by 2020-05-21).
- All dates show similar age-group progression, but later dates have higher ratios.
- 60-69 group acts as a baseline (ratio = 1 by definition).
- **Notable patterns**:
- 70-79 and older groups show the largest relative increases (e.g., 90+ group ratio rises from ~10⁰ to ~10²).
- Lines for 2020-05-21 are consistently above earlier dates across all age groups.
### Key Observations
1. **Age-Group Disparity**: Older age groups (60+) exhibit significantly higher ΔÂ(t) values and ratios compared to younger groups.
2. **Temporal Acceleration**: Both metrics increase over time, with the steepest growth observed in the final observation period (2020-05-21).
3. **Baseline Reference**: The 60-69 age group serves as a normalization anchor in Graph B, highlighting relative growth in older cohorts.
### Interpretation
The data suggests a strong correlation between age and the magnitude of ΔÂ(t), with older populations experiencing disproportionately higher values. The ratio in Graph B indicates that growth in ΔÂ(t) accelerates more sharply in age groups older than 60-69 over time. This could imply age-related vulnerability or exposure factors in a public health context (e.g., disease spread, resource allocation). The consistent upward trend across dates highlights a worsening trend, potentially signaling the need for targeted interventions for elderly populations. Uncertainties include the exact nature of ΔÂ(t) and whether the logarithmic scale compresses late-stage growth.