## Line Graph: Accuracy vs Training Steps (10³)
### Overview
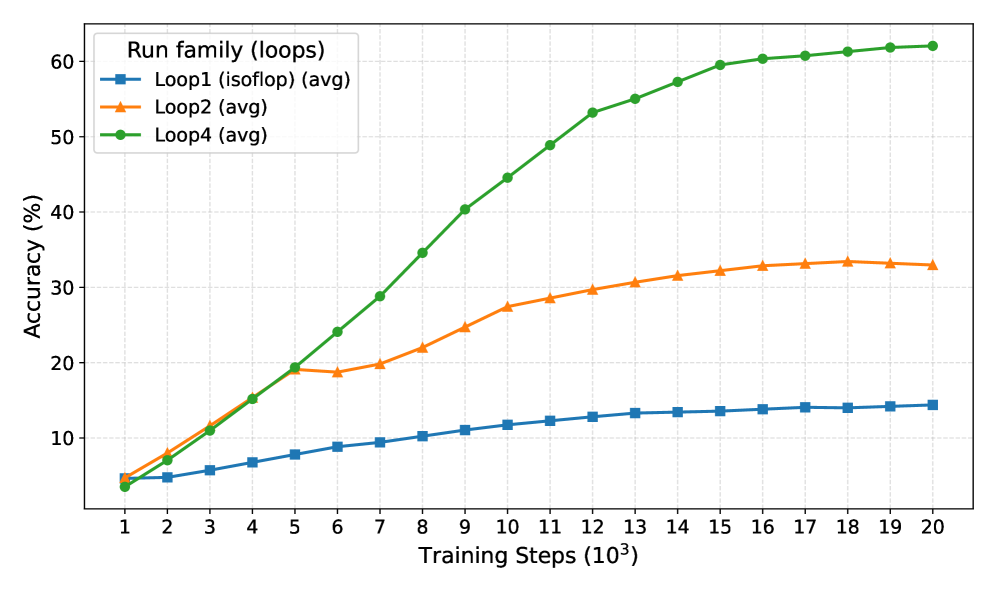
The graph compares the accuracy (%) of three training loops (Loop1, Loop2, Loop4) across 20,000 training steps (10³ increments). Accuracy is plotted on the y-axis (0–60%), and training steps on the x-axis (1–20,000). Loop4 demonstrates the highest performance, while Loop1 shows the slowest growth.
### Components/Axes
- **X-axis**: Training Steps (10³) labeled from 1 to 20 (representing 1,000 to 20,000 steps).
- **Y-axis**: Accuracy (%) ranging from 0 to 60.
- **Legend**: Located in the top-left corner, with three entries:
- **Loop1 (isoflop) (avg)**: Blue squares.
- **Loop2 (avg)**: Orange triangles.
- **Loop4 (avg)**: Green circles.
### Detailed Analysis
1. **Loop1 (blue squares)**:
- Starts at ~5% accuracy at step 1.
- Gradual linear increase to ~14% by step 20.
- Slope: ~0.45% per 1,000 steps.
2. **Loop2 (orange triangles)**:
- Begins at ~5% at step 1.
- Sharp rise to ~19% by step 5.
- Plateaus at ~32% from step 13 onward.
- Peak growth: ~3.4% per 1,000 steps (steps 1–5).
3. **Loop4 (green circles)**:
- Starts at ~3% at step 1.
- Rapid exponential growth to ~62% by step 20.
- Slope: ~2.45% per 1,000 steps (steps 1–20).
### Key Observations
- **Loop4 dominance**: Outperforms all others by step 20 (62% vs. 32% and 14%).
- **Loop2 plateau**: Accuracy stabilizes after step 13, suggesting diminishing returns.
- **Loop1 inefficiency**: Slowest growth rate, indicating suboptimal training dynamics.
### Interpretation
The data suggests that Loop4’s architecture or hyperparameters enable significantly faster convergence compared to Loop1 and Loop2. The plateau in Loop2 implies that additional training steps beyond 13,000 yield minimal gains, while Loop1’s linear trend highlights inefficiencies in its design. These results could inform optimization strategies for training loops in machine learning pipelines, emphasizing the importance of loop configuration in achieving high accuracy with limited computational resources.