\n
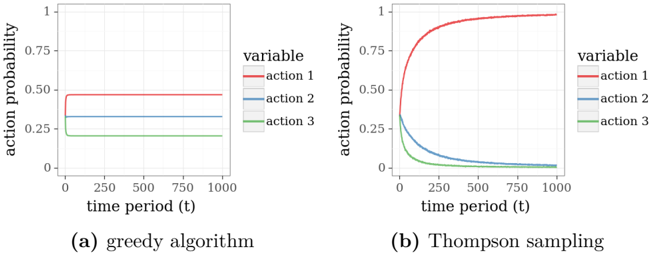
## Line Charts: Action Probability vs. Time Period for Two Algorithms
### Overview
The image presents two line charts comparing the action probability of three actions (Action 1, Action 2, Action 3) over a time period of 1000 units. The left chart (a) represents the "greedy algorithm", while the right chart (b) represents "Thompson sampling". Both charts share the same axes: time period (t) on the x-axis and action probability on the y-axis, ranging from 0 to 1.
### Components/Axes
* **X-axis:** "time period (t)", ranging from 0 to 1000.
* **Y-axis:** "action probability", ranging from 0 to 1.
* **Legend (top-right of both charts):**
* "variable" label.
* "action 1" (represented by a red line).
* "action 2" (represented by a grey line).
* "action 3" (represented by a green line).
* **Chart (a) Title:** "(a) greedy algorithm" positioned below the chart.
* **Chart (b) Title:** "(b) Thompson sampling" positioned below the chart.
### Detailed Analysis or Content Details
**Chart (a): Greedy Algorithm**
* **Action 1 (Red Line):** The line is approximately horizontal, starting at a probability of ~0.52 and remaining relatively constant at ~0.51 throughout the entire time period (0-1000).
* **Action 2 (Grey Line):** The line is approximately horizontal, starting at a probability of ~0.32 and remaining relatively constant at ~0.31 throughout the entire time period (0-1000).
* **Action 3 (Green Line):** The line is approximately horizontal, starting at a probability of ~0.16 and remaining relatively constant at ~0.15 throughout the entire time period (0-1000).
**Chart (b): Thompson Sampling**
* **Action 1 (Red Line):** The line exhibits an upward trend, starting at a probability of ~0.05 at t=0, rapidly increasing to approximately ~0.85 by t=250, and then leveling off to a probability of ~0.82 by t=1000.
* **Action 2 (Grey Line):** The line exhibits a downward trend, starting at a probability of ~0.45 at t=0, decreasing to approximately ~0.15 by t=250, and then leveling off to a probability of ~0.12 by t=1000.
* **Action 3 (Green Line):** The line exhibits a downward trend, starting at a probability of ~0.5 at t=0, decreasing to approximately ~0.03 by t=250, and then leveling off to a probability of ~0.02 by t=1000.
### Key Observations
* The "greedy algorithm" maintains constant action probabilities throughout the time period, indicating a lack of adaptation or learning.
* "Thompson sampling" demonstrates dynamic action probabilities, with Action 1 increasing in probability while Actions 2 and 3 decrease. This suggests that Thompson sampling is learning to favor Action 1 over time.
* The initial probabilities in Thompson sampling are different from the greedy algorithm, showing an initial exploration phase.
### Interpretation
The charts illustrate the difference in behavior between a greedy algorithm and Thompson sampling in a decision-making process. The greedy algorithm consistently selects actions based on their initial probabilities, without adapting to new information. In contrast, Thompson sampling dynamically adjusts action probabilities based on observed outcomes, leading to a convergence towards the optimal action (Action 1 in this case). The initial exploration phase of Thompson sampling is evident in the changing probabilities at the beginning of the time period. The leveling off of the lines in Thompson sampling suggests that the algorithm has reached a stable state where it consistently favors Action 1. This demonstrates the ability of Thompson sampling to balance exploration and exploitation, ultimately leading to better performance than a static greedy approach.