## Line Chart: Attention Key Query Score, a=128
### Overview
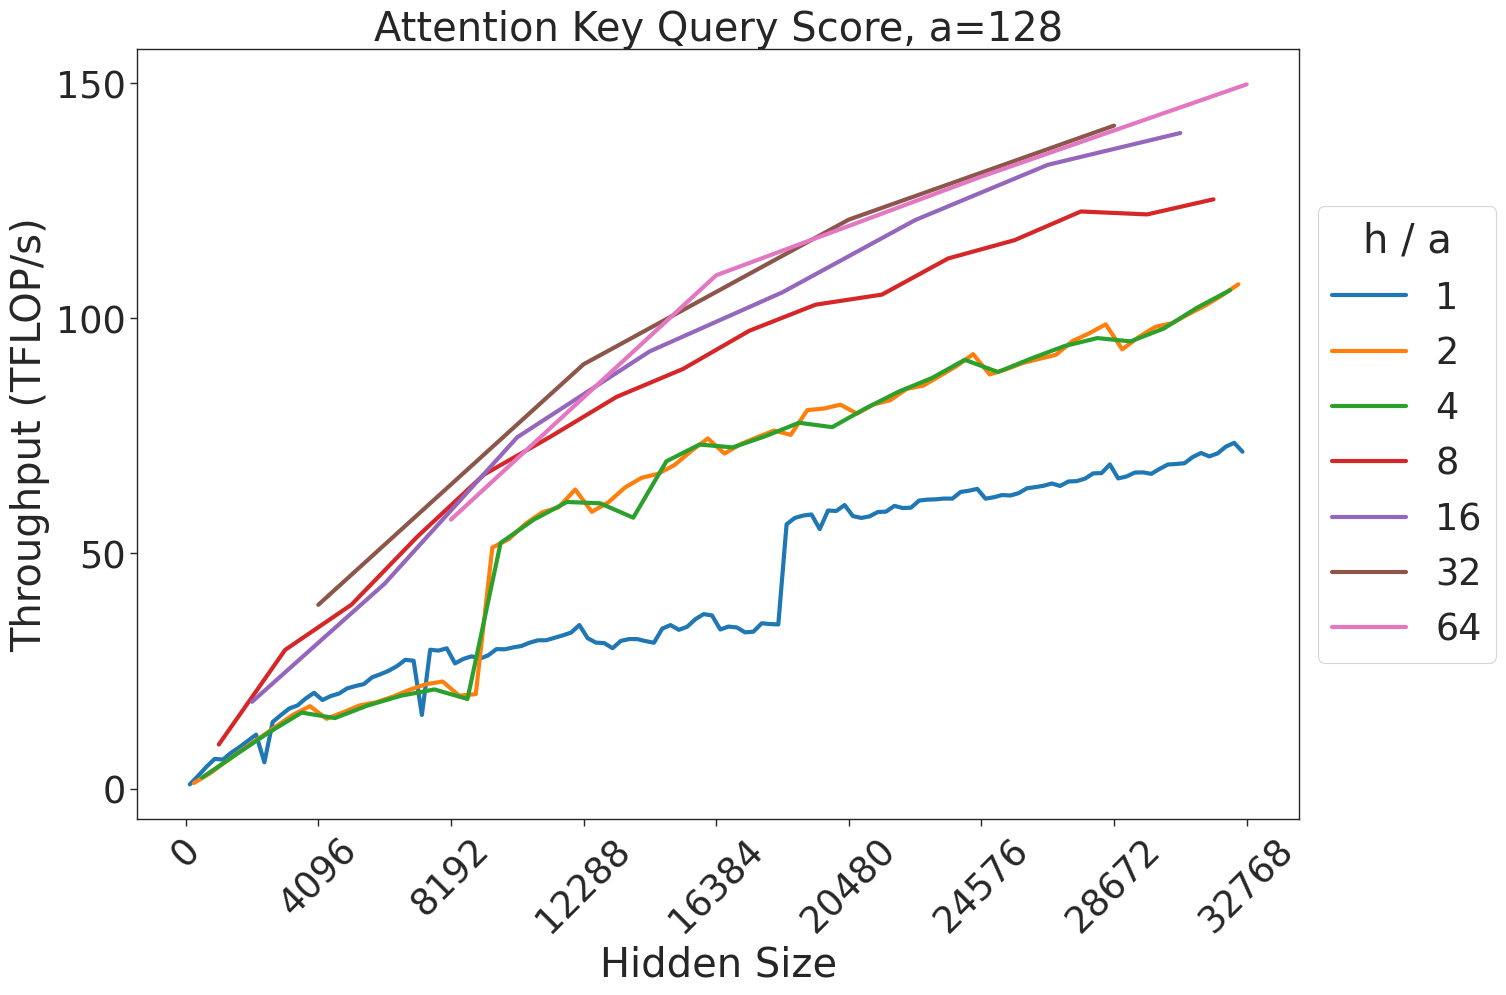
This image is a line chart illustrating the relationship between "Hidden Size" (x-axis) and "Throughput (TFLOP/s)" (y-axis) for an attention mechanism, parameterized by a fixed value "a=128". The chart displays seven distinct data series, each representing a different "h / a" ratio.
### Components/Axes
* **Title:** "Attention Key Query Score, a=128"
* **X-Axis:** Labeled "Hidden Size". The scale ranges from 0 to 32768, with major tick marks at 0, 4096, 8192, 12288, 16384, 20480, 24576, 28672, and 32768.
* **Y-Axis:** Labeled "Throughput (TFLOP/s)". The scale ranges from 0 to 150, with major tick marks at 0, 50, 100, and 150.
* **Legend:** Positioned on the right side of the chart. It is labeled "h / a" and lists seven values corresponding to the line colors:
* **Blue:** 1
* **Orange:** 2
* **Green:** 4
* **Red:** 8
* **Purple:** 16
* **Brown:** 32
* **Pink:** 64
### Detailed Analysis
The chart displays seven data series, all showing a general upward trend (positive correlation) between Hidden Size and Throughput.
* **h/a = 1 (Blue Line):**
* **Trend:** Starts at 0, rises gradually.
* **Anomaly:** There is a sharp, vertical discontinuity (step-up) at a Hidden Size of approximately 18,000, where throughput jumps from ~35 TFLOP/s to ~60 TFLOP/s.
* **End Point:** Reaches approximately 70 TFLOP/s at a Hidden Size of 32,768.
* **h/a = 2 (Orange Line) & h/a = 4 (Green Line):**
* **Trend:** These two lines are nearly identical and overlap significantly throughout the entire range.
* **End Point:** Both reach approximately 105–110 TFLOP/s at a Hidden Size of 32,768.
* **h/a = 8 (Red Line):**
* **Trend:** Consistently higher throughput than the 1, 2, and 4 series.
* **End Point:** Reaches approximately 125 TFLOP/s at a Hidden Size of 32,768.
* **h/a = 16 (Purple Line) & h/a = 32 (Brown Line):**
* **Trend:** These two lines are very close to each other, with the Brown line (32) slightly higher than the Purple line (16) in the mid-range.
* **End Point:** Both lines terminate around a Hidden Size of 28,672, reaching approximately 140 TFLOP/s.
* **h/a = 64 (Pink Line):**
* **Trend:** This line represents the highest throughput across the entire range.
* **End Point:** Reaches approximately 150 TFLOP/s at a Hidden Size of 32,768.
### Key Observations
* **Positive Correlation:** Increasing the "h/a" ratio generally results in higher throughput for a given hidden size.
* **Kernel/Algorithm Switch:** The sharp discontinuity in the Blue line (h/a=1) at ~18,000 Hidden Size strongly suggests a change in the underlying computational kernel or memory management strategy (e.g., switching from a standard attention implementation to a more optimized one) at that specific threshold.
* **Diminishing Returns/Clustering:** The performance gap between the lines decreases as the "h/a" ratio increases. The lines for 2/4 and 16/32 are tightly clustered, suggesting that increasing the ratio beyond certain points yields diminishing performance gains.
### Interpretation
This chart is a performance benchmark for an attention mechanism, likely running on a GPU. The "a=128" likely refers to the attention head dimension. The "h/a" ratio likely represents the number of heads relative to the attention dimension.
The data demonstrates that throughput is highly sensitive to the configuration of the attention mechanism. The most notable finding is the non-linear behavior of the "h/a=1" configuration, which indicates that the system likely employs different execution paths or optimizations based on the input size. The clustering of the other lines suggests that while increasing the head count (or ratio) improves performance, there is a saturation point where hardware utilization is maximized, and further increases in the ratio provide negligible throughput improvements. The termination of the 16 and 32 lines before the maximum x-axis value may indicate memory constraints or unsupported configurations for those specific parameters at higher hidden sizes.