\n
## Bar Chart: Accuracy vs. Problem Type & Row Count
### Overview
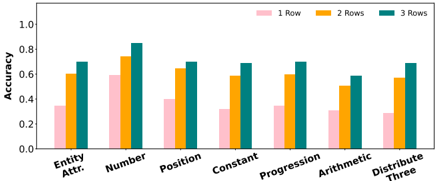
This image presents a bar chart comparing the accuracy of a system or method across different problem types, categorized by the number of rows involved. The x-axis represents the problem type, and the y-axis represents the accuracy score. Three different row counts (1, 2, and 3) are represented by different colored bars for each problem type.
### Components/Axes
* **X-axis:** Problem Type - with categories: "Entity Attr.", "Number", "Position", "Constant", "Progression", "Arithmetic", "Distribute Three".
* **Y-axis:** Accuracy - Scale ranges from 0.0 to 1.0, with increments of 0.2.
* **Legend:** Located at the top-right corner.
* Pink: 1 Row
* Orange: 2 Rows
* Teal: 3 Rows
### Detailed Analysis
The chart consists of seven groups of three bars, one for each problem type and row count combination.
* **Entity Attr.:**
* 1 Row (Pink): Approximately 0.35
* 2 Rows (Orange): Approximately 0.65
* 3 Rows (Teal): Approximately 0.60
* **Number:**
* 1 Row (Pink): Approximately 0.55
* 2 Rows (Orange): Approximately 0.75
* 3 Rows (Teal): Approximately 0.85
* **Position:**
* 1 Row (Pink): Approximately 0.40
* 2 Rows (Orange): Approximately 0.65
* 3 Rows (Teal): Approximately 0.65
* **Constant:**
* 1 Row (Pink): Approximately 0.30
* 2 Rows (Orange): Approximately 0.60
* 3 Rows (Teal): Approximately 0.60
* **Progression:**
* 1 Row (Pink): Approximately 0.55
* 2 Rows (Orange): Approximately 0.60
* 3 Rows (Teal): Approximately 0.70
* **Arithmetic:**
* 1 Row (Pink): Approximately 0.50
* 2 Rows (Orange): Approximately 0.55
* 3 Rows (Teal): Approximately 0.70
* **Distribute Three:**
* 1 Row (Pink): Approximately 0.30
* 2 Rows (Orange): Approximately 0.60
* 3 Rows (Teal): Approximately 0.65
### Key Observations
* Generally, accuracy increases with the number of rows for most problem types.
* The "Number" problem type consistently shows the highest accuracy, especially with 3 rows.
* "Entity Attr.", "Constant", and "Distribute Three" have the lowest accuracy scores, particularly with only 1 row.
* The difference in accuracy between 2 and 3 rows is less pronounced than the difference between 1 and 2 rows.
### Interpretation
The data suggests that the system's performance improves with increased complexity (more rows) for most problem types. This could indicate that the system benefits from having more data points to work with, or that the additional rows help to disambiguate the problem. The consistently high accuracy on "Number" problems suggests that the system is particularly well-suited for tasks involving numerical reasoning. The lower accuracy on "Entity Attr.", "Constant", and "Distribute Three" problems may indicate that these problem types are inherently more difficult, or that the system requires further training on these types of problems. The diminishing returns in accuracy gains between 2 and 3 rows could suggest a point of saturation, where adding more rows does not significantly improve performance.