## Diagram: Shape Rasterization
### Overview
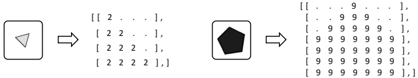
The image illustrates the rasterization process of two different shapes: a triangle and a pentagon. Each shape is represented within a rounded square, followed by an arrow indicating a transformation into a matrix of numerical values. The values within the matrix represent the coverage or fill of the shape at each grid location.
### Components/Axes
* **Shapes:** A light gray triangle on the left and a dark pentagon on the right.
* **Arrows:** Two arrows pointing from the shape representations to their corresponding numerical matrices.
* **Numerical Matrices:** Two matrices representing the rasterized shapes. The left matrix contains the number '2' and periods, while the right matrix contains the number '9' and periods.
### Detailed Analysis
**Left Side (Triangle Rasterization):**
* The triangle is represented in a rounded square.
* The arrow points to a matrix that appears to be 4x5 (4 rows, 5 columns).
* The matrix contains the number '2' where the triangle would be, and periods elsewhere.
* The matrix is structured as follows:
```
[[2 . . . .],
[2 2 . . .],
[2 2 2 . .],
[2 2 2 2 .]]
```
**Right Side (Pentagon Rasterization):**
* The pentagon is represented in a rounded square.
* The arrow points to a matrix that appears to be 7x11 (7 rows, 11 columns).
* The matrix contains the number '9' where the pentagon would be, and periods elsewhere.
* The matrix is structured as follows:
```
[[. . . . . 9 . . . . .],
[. . . . 9 9 9 . . . .],
[. . . 9 9 9 9 9 . . .],
[. . 9 9 9 9 9 9 9 . .],
[. 9 9 9 9 9 9 9 9 9 .],
[. 9 9 9 9 9 9 9 9 9 .],
[. . 9 9 9 9 9 9 9 . .]]
```
### Key Observations
* The '2' and '9' values likely represent the intensity or coverage of the shape at each pixel location.
* The periods represent empty or uncovered pixels.
* The matrices visually represent the shapes in a pixelated form.
### Interpretation
The diagram illustrates a basic concept of rasterization, where continuous shapes are converted into discrete pixel representations. The numerical matrices represent the pixel grid, and the values within them indicate how much of each pixel is covered by the original shape. This process is fundamental in computer graphics for rendering shapes on digital displays. The difference in the values ('2' vs '9') might indicate different levels of fill or intensity, or simply be arbitrary values used to distinguish the two shapes. The pentagon requires a larger matrix due to its more complex shape and larger size compared to the triangle.