\n
## Comparative Analysis of MCQ vs. OSQ Performance Across Four Large Language Models
### Overview
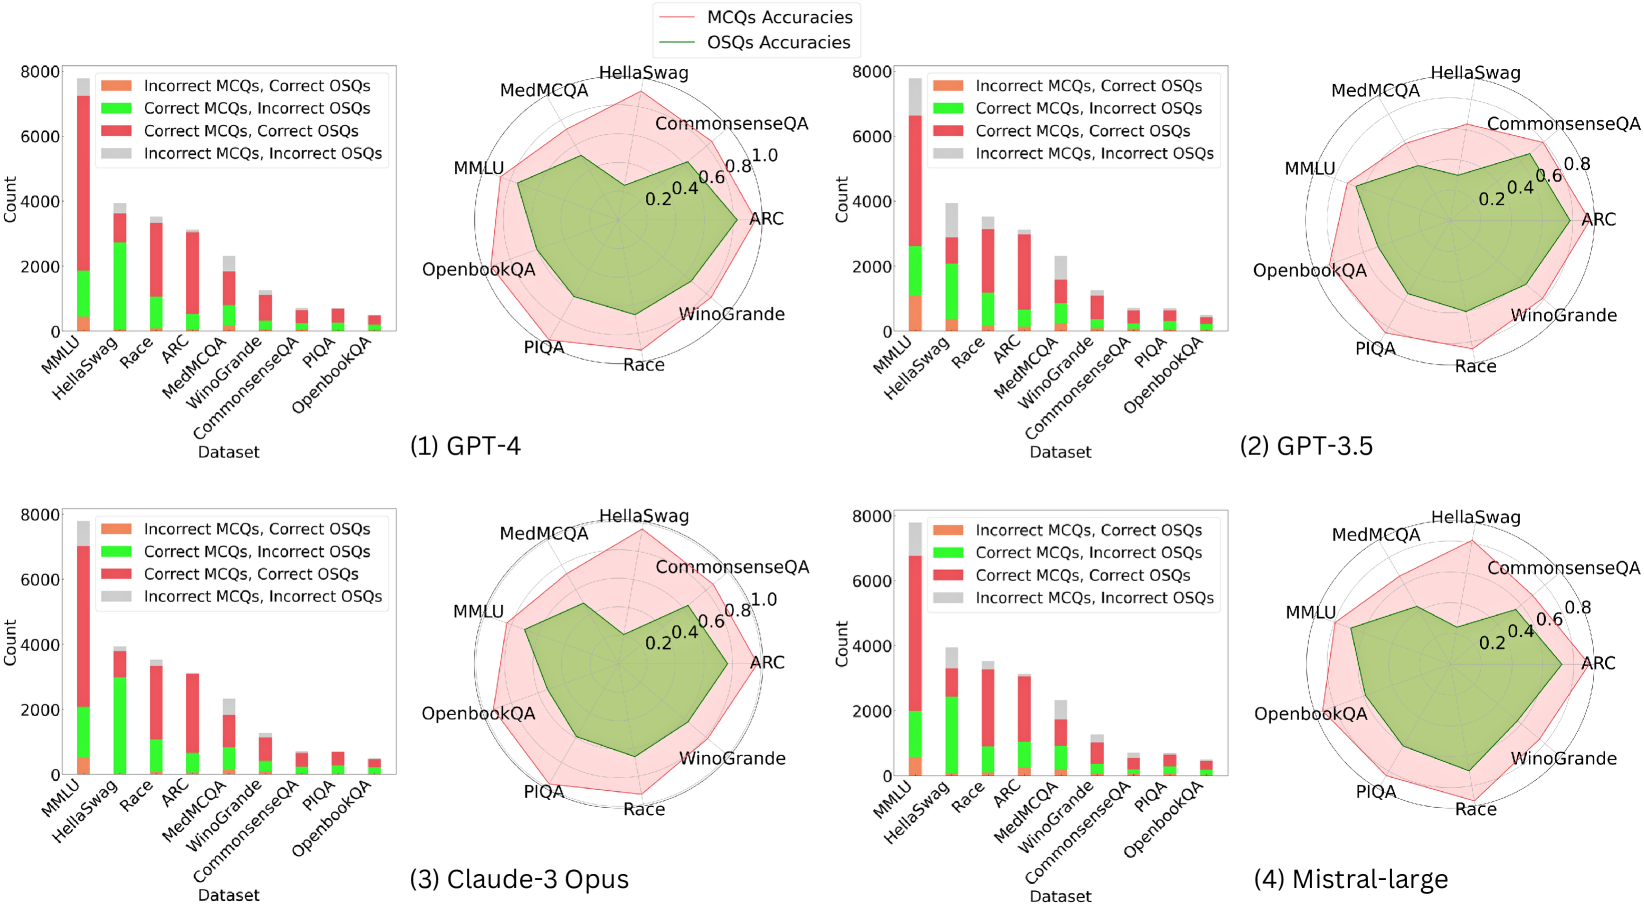
The image presents a comparative analysis of four Large Language Models (LLMs)—GPT-4, GPT-3.5, Claude-3 Opus, and Mistral-large—across eight benchmark datasets. For each model, performance is visualized using two complementary charts: a stacked bar chart showing the count distribution of correct/incorrect responses for Multiple-Choice Questions (MCQs) and Open-Ended/Short-Answer Questions (OSQs), and a radar chart comparing the overall accuracy percentages for MCQs and OSQs.
### Components/Axes
**Common Elements Across All Four Panels:**
* **Datasets (X-axis for Bar Charts, Categories for Radar Charts):** MMLU, HellaSwag, Race, ARC, MedMCQA, WinoGrande, CommonsenseQA, PIQA, OpenbookQA.
* **Bar Chart Y-axis:** "Count", with a scale from 0 to 8000.
* **Bar Chart Legend (Top-Left of each bar chart):**
* Orange: Incorrect MCQs, Correct OSQs
* Green: Correct MCQs, Incorrect OSQs
* Red: Correct MCQs, Correct OSQs
* Gray: Incorrect MCQs, Incorrect OSQs
* **Radar Chart Legend (Top-Center of each panel):**
* Pink Line/Area: MCQs Accuracies
* Green Line/Area: OSQs Accuracies
* **Radar Chart Scale:** Concentric circles marked at 0.2, 0.4, 0.6, 0.8, and 1.0 (representing 20% to 100% accuracy).
**Panel-Specific Labels:**
* Panel (1): GPT-4
* Panel (2): GPT-3.5
* Panel (3): Claude-3 Opus
* Panel (4): Mistral-large
### Detailed Analysis
**1. GPT-4 (Panel 1)**
* **Bar Chart:** The "Correct MCQs, Correct OSQs" (red) segment is dominant across most datasets, especially for MMLU (~7000 count). The "Incorrect MCQs, Correct OSQs" (orange) segment is notably small. The "Correct MCQs, Incorrect OSQs" (green) segment is significant for HellaSwag and Race.
* **Radar Chart:** The pink area (MCQ accuracy) is larger than the green area (OSQ accuracy) for all datasets. MCQ accuracy is highest for CommonsenseQA (~0.9) and lowest for MedMCQA (~0.7). OSQ accuracy is highest for CommonsenseQA (~0.8) and lowest for MedMCQA (~0.5).
**2. GPT-3.5 (Panel 2)**
* **Bar Chart:** The total counts are lower than GPT-4. The "Correct MCQs, Correct OSQs" (red) segment is still prominent but smaller. The "Incorrect MCQs, Correct OSQs" (orange) segment is more visible, particularly for MMLU and HellaSwag.
* **Radar Chart:** The gap between MCQ (pink) and OSQ (green) accuracy is wider than for GPT-4. MCQ accuracy peaks at CommonsenseQA (~0.8) and dips at MedMCQA (~0.6). OSQ accuracy is generally lower, with a notable low point at MedMCQA (~0.3).
**3. Claude-3 Opus (Panel 3)**
* **Bar Chart:** The distribution resembles GPT-4's pattern, with a strong red segment. The green segment ("Correct MCQs, Incorrect OSQs") appears slightly larger for some datasets like HellaSwag compared to GPT-4.
* **Radar Chart:** The performance profile is very similar to GPT-4. MCQ accuracy is high, peaking near 0.9 for CommonsenseQA. OSQ accuracy is also strong, with the smallest gap between the two accuracies observed on the CommonsenseQA dataset.
**4. Mistral-large (Panel 4)**
* **Bar Chart:** Shows a pattern similar to GPT-3.5, with lower overall counts and a more pronounced orange segment ("Incorrect MCQs, Correct OSQs") compared to GPT-4 and Claude-3 Opus.
* **Radar Chart:** Exhibits a performance profile between GPT-3.5 and the top models. The MCQ accuracy (pink) is respectable, peaking around 0.85 for CommonsenseQA. The OSQ accuracy (green) is lower, with a significant dip for MedMCQA (~0.4).
### Key Observations
1. **Consistent Dataset Hierarchy:** Across all four models, CommonsenseQA consistently yields the highest accuracies for both MCQs and OSQs. Conversely, MedMCQA consistently results in the lowest accuracies, especially for OSQs.
2. **MCQ vs. OSQ Gap:** In every model and on nearly every dataset, MCQ accuracy (pink line/area) is higher than OSQ accuracy (green line/area). This gap is smallest for GPT-4 and Claude-3 Opus and largest for GPT-3.5.
3. **Model Performance Tiers:** GPT-4 and Claude-3 Opus form a top tier with very similar, high-performance profiles. Mistral-large occupies a middle tier, and GPT-3.5 shows the lowest relative performance, particularly on OSQs.
4. **Bar Chart Correlation:** The models with the highest radar chart accuracies (GPT-4, Claude-3) also have the largest red segments ("Correct MCQs, Correct OSQs") in their bar charts, indicating consistent correctness across both question formats.
### Interpretation
This visualization provides a multi-faceted view of LLM capabilities, moving beyond simple accuracy scores. The data suggests a fundamental challenge: **generating correct open-ended answers (OSQs) is consistently harder for these models than selecting the correct multiple-choice option (MCQs), even when testing the same underlying knowledge.**
The strong correlation between high MCQ/OSQ accuracy and a large "Correct/Correct" (red) bar segment indicates that models which are robustly knowledgeable perform well regardless of answer format. The notable dip in OSQ performance on the MedMCQA dataset across all models may point to a specific weakness in medical domain knowledge retrieval or generation, or it may reflect a characteristic of that dataset's OSQ format.
The near-identical performance profiles of GPT-4 and Claude-3 Opus suggest a potential convergence in capability among top-tier models on these benchmarks. The analysis highlights that evaluating LLMs requires examining performance across different interaction modalities (selection vs. generation) and diverse knowledge domains, as strengths in one area (e.g., MCQs on CommonsenseQA) do not guarantee equivalent strength in another (e.g., OSQs on MedMCQA).