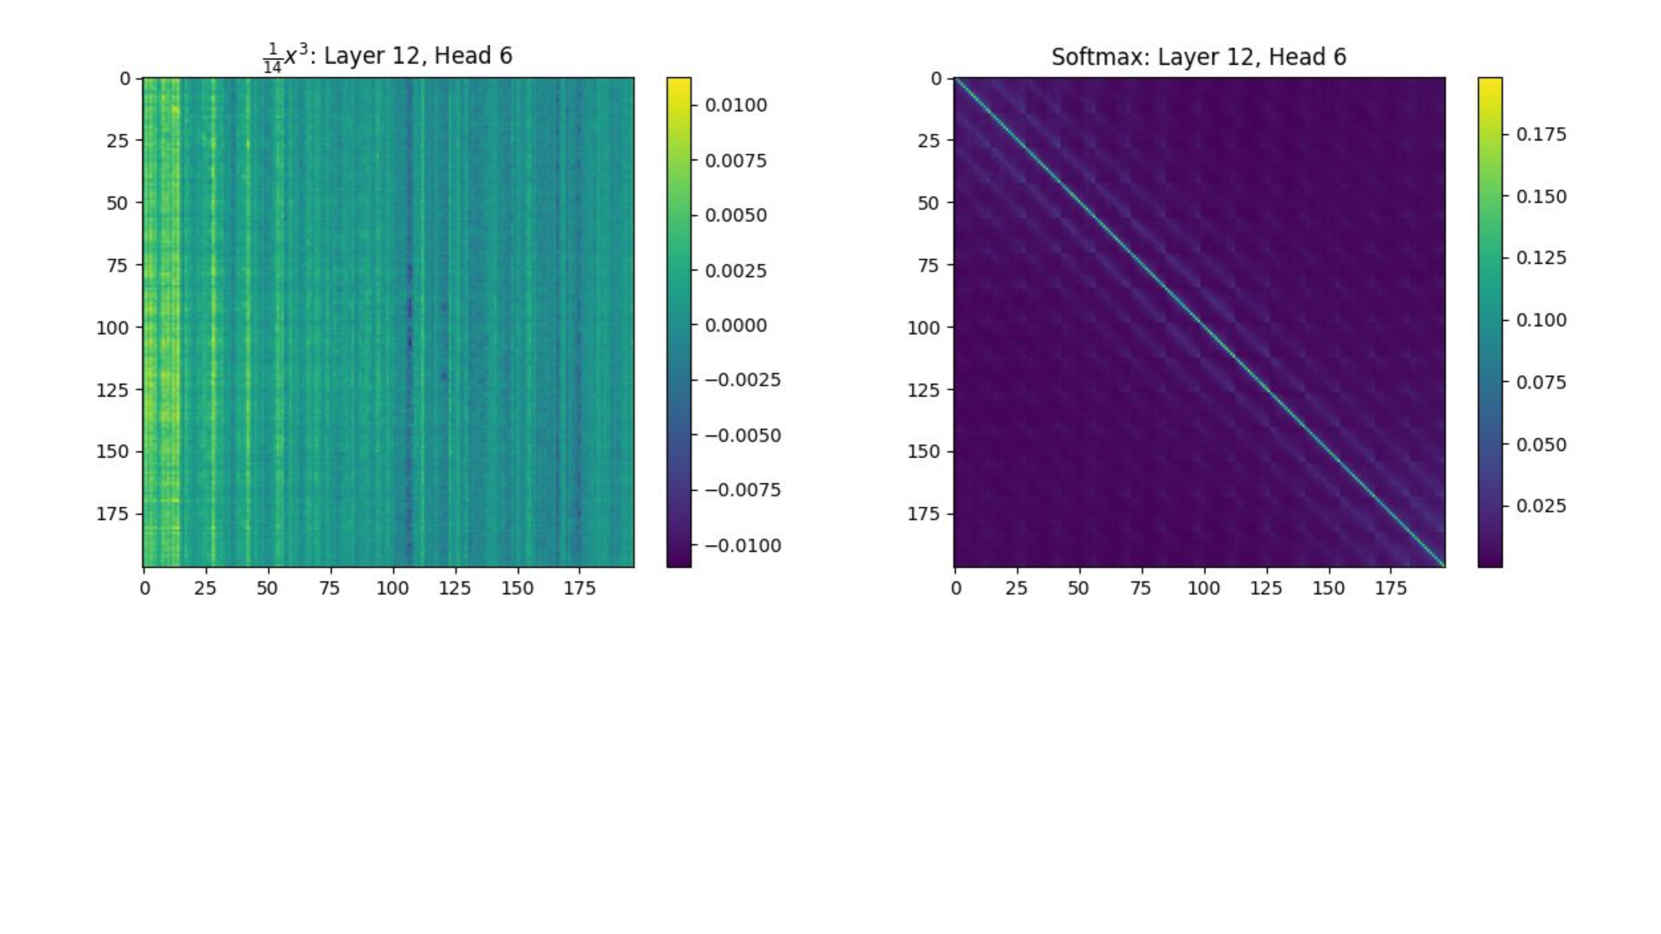
## Heatmaps: Layer 12, Head 6 (Left) and Softmax (Right)
### Overview
Two side-by-side heatmaps visualize attention patterns in a neural network layer. The left heatmap represents a cubic transformation (`1/14 x³`), while the right shows softmax-normalized values. Both correspond to Layer 12, Head 6 of a transformer model.
### Components/Axes
- **X-axis (horizontal)**: Position indices (0–175, increments of 25)
- **Y-axis (vertical)**: Position indices (0–175, increments of 25)
- **Color scales**:
- Left: [-0.0100, 0.0100] (purple to yellow)
- Right: [0.025, 0.175] (dark purple to yellow)
- **Legend placement**: Right side of each heatmap
### Detailed Analysis
#### Left Heatmap (`1/14 x³`)
- **Structure**: Vertical stripes with alternating intensity
- **Key values**:
- Bright yellow stripes: ~0.0100 (top-left corner)
- Dark purple regions: ~-0.0100 (bottom-left corner)
- Intermediate green: ~0.0000 (center)
- **Pattern**: Regular vertical oscillations with amplitude ~0.01
#### Right Heatmap (Softmax)
- **Structure**: Diagonal gradient from top-left to bottom-right
- **Key values**:
- Bright yellow diagonal: ~0.175 (top-left to bottom-right)
- Dark purple off-diagonal: ~0.025
- **Pattern**: Exponential decay from diagonal (typical softmax behavior)
### Key Observations
1. **Left heatmap** shows structured periodicity with ~25-unit wavelength (matches axis increments)
2. **Right heatmap** exhibits strong diagonal dominance (typical of attention mechanisms)
3. Color scales differ by magnitude: left uses ±0.01, right uses 0.025–0.175
4. Both share identical axis ranges (0–175) and grid structure
### Interpretation
The left heatmap likely represents a positional encoding transformation (`1/14 x³`), showing how positional information is modulated through the layer. The vertical stripes suggest the model captures periodic positional relationships. The right heatmap's softmax output demonstrates attention concentration along the diagonal, indicating the model prioritizes matching input-output positions. The stark contrast in color scales between the two heatmaps highlights different scales of information processing - the cubic transformation operates at smaller magnitude values compared to the normalized softmax outputs.