## Diagram: Binary Stochastic Neuron & Probability Visualization
### Overview
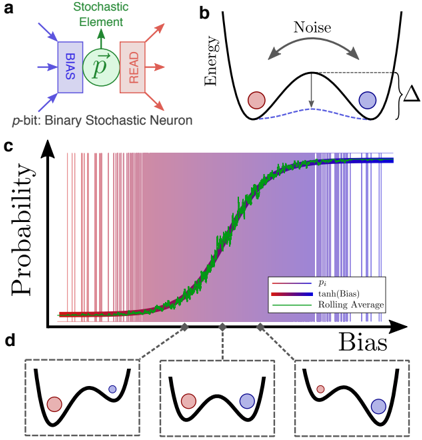
This image presents a conceptual diagram illustrating a binary stochastic neuron (p-bit) and its probabilistic behavior. It consists of a schematic of the neuron, a visualization of energy landscape with noise, and a probability plot showing the relationship between bias and probability. The bottom section shows the energy landscape at different bias values.
### Components/Axes
The image is divided into four sections labeled (a), (b), (c), and (d).
* **(a): Stochastic Element:** Shows a schematic of the neuron with "BIAS" inputs (blue arrows) and a "READ" output (red box). Inside the neuron is a circle labeled "p". Below this is the text "p-bit: Binary Stochastic Neuron".
* **(b): Energy Landscape:** A plot of "Energy" vs. an unspecified axis. It depicts a double-well potential with two states represented by red and blue circles. An arrow labeled "Noise" indicates fluctuations between the states. A delta symbol (Δ) is present on the y-axis.
* **(c): Probability vs. Bias Plot:** A plot of "Probability" (y-axis) vs. "Bias" (x-axis). It features three curves:
* Red line: labeled "p"
* Blue line: labeled "tanh (Bias)"
* Green line: labeled "Rolling Average"
The background is shaded with purple on the left and light blue on the right. Vertical lines are present throughout the plot.
* **(d): Energy Landscapes at Different Biases:** Three energy landscapes are shown, each corresponding to a different bias value. The landscapes are similar to (b), but the position of the red and blue circles changes with increasing bias. Arrows connect these landscapes to the corresponding points on the x-axis of plot (c).
### Detailed Analysis or Content Details
* **(a):** The "BIAS" inputs are represented as multiple blue arrows converging on the stochastic element. The output "READ" is a red box. The circle labeled "p" likely represents the probability of the neuron being in the active state.
* **(b):** The energy landscape shows two potential wells. The red circle represents a state with lower energy, and the blue circle represents a state with higher energy. The "Noise" arrow indicates that the system can overcome the energy barrier and transition between states. The delta symbol (Δ) is not quantified.
* **(c):**
* The red line ("p") shows a highly fluctuating probability, with values oscillating between approximately 0 and 1.
* The blue line ("tanh(Bias)") is a smooth, sigmoid-shaped curve. It starts near 0 for negative bias values, increases rapidly around bias = 0, and approaches 1 for positive bias values.
* The green line ("Rolling Average") is a smoothed version of the red line, showing the overall trend. It also follows a sigmoid shape, similar to the blue line.
* The purple shaded region on the left side of the plot corresponds to low probability values, while the light blue shaded region on the right corresponds to high probability values.
* **(d):** As the bias increases (from left to right), the energy well corresponding to the blue circle deepens, while the energy well corresponding to the red circle shallows. This indicates that the system is more likely to be in the blue state at higher bias values.
### Key Observations
* The stochastic neuron exhibits probabilistic behavior, with the probability of being in the active state (represented by "p") fluctuating significantly.
* The "tanh(Bias)" curve provides a deterministic prediction of the probability based on the bias.
* The rolling average smooths out the fluctuations and reveals the underlying trend.
* The energy landscape visualization helps to understand the physical basis of the probabilistic behavior.
### Interpretation
The diagram illustrates how a binary stochastic neuron can be modeled as a system with an energy landscape and noise. The bias controls the shape of the energy landscape, influencing the probability of the neuron being in different states. The noise allows the system to overcome energy barriers and transition between states, resulting in probabilistic behavior. The "tanh(Bias)" curve represents the deterministic component of the probability, while the fluctuations around this curve are due to the noise. The rolling average provides a way to estimate the underlying trend despite the noise. This model is relevant to understanding neural networks and other systems that exhibit stochastic behavior. The diagram suggests that the neuron's behavior is governed by a balance between deterministic bias and random noise. The energy landscape provides a visual metaphor for the decision-making process of the neuron.