## Line Chart: Thinking Compute vs. Accuracy
### Overview
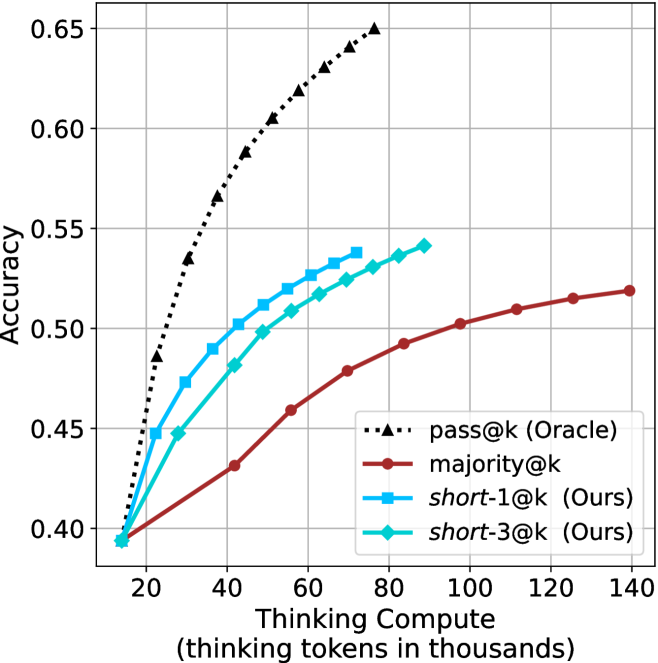
This image displays a line chart comparing the performance (Accuracy) of four different inference strategies against the amount of "Thinking Compute" (measured in thousands of thinking tokens) utilized by an AI model. The chart demonstrates that increasing compute generally improves accuracy, but the efficiency of that improvement varies significantly by method.
### Components/Axes
* **Y-Axis (Vertical):** Labeled "Accuracy". The scale ranges from 0.40 to 0.65, with major grid lines at 0.05 intervals.
* **X-Axis (Horizontal):** Labeled "Thinking Compute (thinking tokens in thousands)". The scale ranges from 20 to 140, with major grid lines at 20-unit intervals. The data series actually begins slightly to the left of the 20 mark, at approximately 14.
* **Legend:** Located in the bottom-right quadrant of the chart area.
* **pass@k (Oracle):** Black dotted line with triangle markers.
* **majority@k:** Dark red solid line with circle markers.
* **short-1@k (Ours):** Light blue solid line with square markers.
* **short-3@k (Ours):** Cyan/Teal solid line with diamond markers.
### Detailed Analysis
All four data series originate from a common starting point at approximately (14, 0.395).
**1. pass@k (Oracle) [Black, Dotted, Triangles]**
* **Trend:** This series exhibits the steepest upward trajectory, representing the theoretical upper bound of performance. It shows diminishing returns as compute increases but maintains the highest accuracy throughout.
* **Data Points:**
* (20, ~0.48)
* (30, ~0.535)
* (40, ~0.565)
* (50, ~0.59)
* (60, ~0.605)
* (70, ~0.63)
* (75, ~0.65)
**2. short-1@k (Ours) [Light Blue, Solid, Squares]**
* **Trend:** This series shows strong, rapid growth in accuracy relative to compute, outperforming both `majority@k` and `short-3@k`. It plateaus around 75k tokens.
* **Data Points:**
* (20, ~0.45)
* (30, ~0.475)
* (40, ~0.50)
* (50, ~0.51)
* (55, ~0.52)
* (65, ~0.525)
* (75, ~0.54)
**3. short-3@k (Ours) [Cyan/Teal, Solid, Diamonds]**
* **Trend:** This series follows a similar trajectory to `short-1@k` but consistently yields slightly lower accuracy for the same amount of compute. It extends slightly further to the right, ending near 90k tokens.
* **Data Points:**
* (20, ~0.445)
* (30, ~0.45)
* (40, ~0.48)
* (50, ~0.50)
* (60, ~0.515)
* (70, ~0.525)
* (80, ~0.535)
* (88, ~0.54)
**4. majority@k [Dark Red, Solid, Circles]**
* **Trend:** This series has the shallowest slope, indicating the least efficient use of compute tokens for accuracy gains. However, it is the only method that continues to scale up to the maximum displayed compute (140k tokens).
* **Data Points:**
* (20, ~0.40)
* (40, ~0.43)
* (60, ~0.46)
* (80, ~0.49)
* (100, ~0.50)
* (120, ~0.515)
* (140, ~0.52)
### Key Observations
* **Efficiency Gap:** The "Ours" methods (`short-1@k` and `short-3@k`) are significantly more compute-efficient than the `majority@k` baseline. For example, at 60k tokens, `short-1@k` achieves ~0.52 accuracy, whereas `majority@k` requires over 120k tokens to reach a similar level.
* **Oracle Superiority:** The `pass@k (Oracle)` method demonstrates that there is significant headroom for improvement, as it reaches 0.65 accuracy with less than 80k tokens, while the other methods struggle to cross 0.55 accuracy even with more compute.
* **Plateauing:** The "Ours" methods appear to hit a performance plateau earlier than the `majority@k` method, which continues to climb slowly.
### Interpretation
This chart likely originates from research into Large Language Model (LLM) inference optimization, specifically regarding "test-time compute" or "reasoning" strategies.
* **The "Oracle" Baseline:** Represents the ideal scenario where the model selects the correct answer if it appears anywhere in the generated samples.
* **"Ours" vs. "Majority":** The "Ours" methods (likely pruning or selective search strategies) are designed to find the correct answer using fewer tokens than a standard "majority voting" approach. The data suggests these methods are highly effective at boosting accuracy in the low-to-mid compute range (20k–80k tokens).
* **Trade-offs:** The chart illustrates a classic trade-off in AI reasoning: the "Ours" methods provide a "fast path" to higher accuracy, but they may be limited by their search depth or pruning logic, as evidenced by their earlier termination compared to the `majority@k` method.