## Line Graphs: State Value and Average Distance vs. Serial Number
### Overview
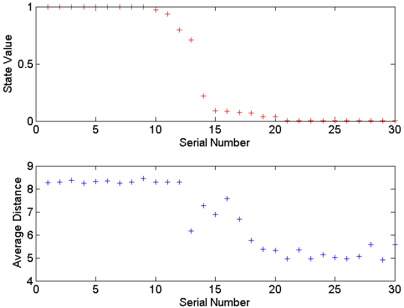
The image contains two vertically stacked line graphs. The top graph plots "State Value" (y-axis) against "Serial Number" (x-axis), while the bottom graph plots "Average Distance" (y-axis) against the same "Serial Number" (x-axis). Both graphs use plus markers (+) to represent data points.
### Components/Axes
- **X-axis (Serial Number)**:
- Range: 0 to 30 (integer increments).
- Label: "Serial Number" (black text).
- **Top Graph (State Value)**:
- Y-axis: "State Value" (black text).
- Scale: 0 to 1 (linear, with ticks at 0, 0.5, 1).
- Data Points: Red plus markers (+).
- **Bottom Graph (Average Distance)**:
- Y-axis: "Average Distance" (black text).
- Scale: 4 to 9 (linear, with ticks at 4, 5, 6, 7, 8, 9).
- Data Points: Blue plus markers (+).
### Detailed Analysis
#### Top Graph (State Value):
- **Trend**:
- Serial Numbers 0–10: State Value remains constant at 1.
- Serial Numbers 11–15: Gradual decline from 1 to ~0.5.
- Serial Numbers 16–20: Sharp drop to 0.
- Serial Numbers 21–30: State Value remains at 0.
- **Key Data Points**:
- Serial 0: 1.0
- Serial 10: 1.0
- Serial 15: ~0.5
- Serial 20: 0.0
#### Bottom Graph (Average Distance):
- **Trend**:
- Serial Numbers 0–10: Average Distance remains constant at ~8.
- Serial Numbers 11–15: Gradual decline from ~8 to ~6.
- Serial Numbers 16–20: Fluctuates between ~5 and ~6.
- Serial Numbers 21–30: Slight increase to ~5.5–6.
- **Key Data Points**:
- Serial 0: ~8.0
- Serial 10: ~8.0
- Serial 15: ~6.0
- Serial 20: ~5.5
- Serial 30: ~5.5
### Key Observations
1. **State Value**:
- Drops to 0 by Serial 20, suggesting a binary or threshold-based behavior (e.g., "on/off" state).
- Sharp decline between Serials 15–20 indicates a critical transition.
2. **Average Distance**:
- Correlates inversely with State Value: both decrease as Serial Number increases.
- Post-Serial 20 fluctuations suggest variability in distance measurements after the State Value stabilizes at 0.
3. **Synchronization**:
- Both graphs share the same x-axis (Serial Number), implying a shared temporal or sequential context.
### Interpretation
- **State Value**: The abrupt drop to 0 at Serial 20 suggests a system reset, failure, or completion of a process. The prior gradual decline (Serials 10–15) may indicate degradation or preparation for this transition.
- **Average Distance**: The inverse relationship with State Value implies that the "distance" metric (e.g., physical, computational, or abstract) decreases as the system transitions from an active state (State Value = 1) to an inactive state (State Value = 0). Post-Serial 20 fluctuations could reflect residual activity or measurement noise.
- **Critical Threshold**: Serial 20 marks a pivotal point where both metrics stabilize, suggesting a system boundary or operational limit.
### Spatial Grounding
- **Legend**: No explicit legend is present. Colors (red for State Value, blue for Average Distance) are inferred from marker colors and axis labels.
- **Positioning**:
- Top graph: State Value (red) occupies the upper half.
- Bottom graph: Average Distance (blue) occupies the lower half.
- Both share the same x-axis (Serial Number), emphasizing their sequential relationship.
### Content Details
- **State Value**:
- Red markers:
- Serials 0–10: 1.0 (exact).
- Serials 11–15: ~0.5–1.0 (approximate).
- Serials 16–20: 0.0 (exact).
- **Average Distance**:
- Blue markers:
- Serials 0–10: ~8.0 (exact).
- Serials 11–15: ~6.0–8.0 (approximate).
- Serials 16–20: ~5.0–6.0 (approximate).
- Serials 21–30: ~5.5–6.0 (approximate).
### Uncertainties
- Exact values for Serials 11–15 (State Value) and 16–20 (Average Distance) are approximate due to marker clustering.
- Post-Serial 20 fluctuations in Average Distance lack clear numerical precision.
### Final Notes
The graphs likely represent a system’s operational lifecycle, where State Value acts as a binary indicator and Average Distance reflects a secondary metric tied to system activity. The absence of a legend necessitates reliance on color coding and axis labels for interpretation.