\n
## Diagram: Causal Diagrams
### Overview
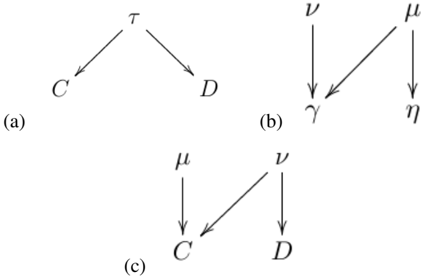
The image presents three directed acyclic graphs (DAGs), labeled (a), (b), and (c). These diagrams represent causal relationships between variables. Each diagram consists of nodes representing variables and arrows indicating the direction of causal influence.
### Components/Axes
The variables represented in the diagrams are:
* τ (Tau)
* C
* D
* ν (Nu)
* μ (Mu)
* γ (Gamma)
* η (Eta)
The diagrams themselves do not have axes in the traditional sense of a chart or graph. They are composed of nodes and directed edges.
### Detailed Analysis or Content Details
**(a)**
This diagram shows a root node labeled 'τ' with arrows pointing to nodes 'C' and 'D'. This indicates that τ is a cause of both C and D.
**(b)**
This diagram shows a chain of causal relationships. 'ν' points to 'γ', which in turn points to 'μ', and 'μ' points to 'η'. This suggests a causal pathway: ν → γ → μ → η.
**(c)**
This diagram shows 'μ' pointing to 'C' and 'ν' pointing to 'D'. Additionally, there is an arrow from 'C' to 'D', indicating that C is a cause of D.
### Key Observations
The diagrams are simple causal models. Diagram (a) represents a common cause scenario. Diagram (b) represents a chain of causation. Diagram (c) represents a more complex relationship with potential confounding or mediation effects.
### Interpretation
These diagrams are likely used to illustrate causal inference concepts. They are tools for representing assumptions about the relationships between variables in a statistical model.
* **Diagram (a)** illustrates a situation where a common cause (τ) influences two variables (C and D). This is important in understanding spurious correlations.
* **Diagram (b)** shows a simple causal chain. Understanding the direction of causality is crucial for interventions and predictions.
* **Diagram (c)** is more complex and suggests that the relationship between ν and D might be mediated by C, or that C and D are causally related.
The diagrams are abstract representations and do not contain numerical data. They are conceptual tools for reasoning about causality. The use of Greek letters suggests a mathematical or theoretical context. The diagrams are likely part of a larger discussion on causal modeling, statistical inference, or related fields.