## Diagram: LLM Factual Associations and Hallucinations
### Overview
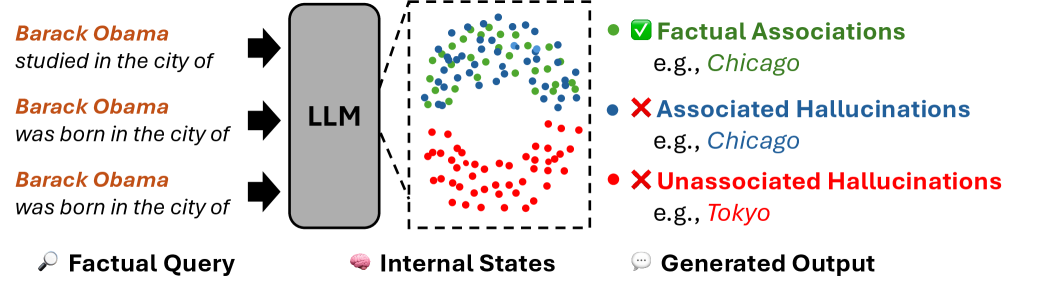
The image is a diagram illustrating how a Large Language Model (LLM) processes factual queries and generates outputs, highlighting the concepts of factual associations, associated hallucinations, and unassociated hallucinations. It shows the flow of information from factual queries to the LLM, the internal states within the LLM, and the generated outputs, categorized by their accuracy.
### Components/Axes
* **Input (Left Side):**
* Three example factual queries about Barack Obama:
* "Barack Obama studied in the city of"
* "Barack Obama was born in the city of" (appears twice)
* A magnifying glass icon labeled "Factual Query"
* **Processing (Center):**
* A gray rounded rectangle labeled "LLM" with three black arrows pointing from the factual queries to the LLM.
* **Internal States (Center-Right):**
* A dashed rectangle representing "Internal States" containing scattered colored dots:
* Green dots: Representing factual associations.
* Blue dots: Representing associated hallucinations.
* Red dots: Representing unassociated hallucinations.
* A brain icon labeled "Internal States"
* **Output (Right Side):**
* Legend explaining the colored dots:
* Green dot with a checkmark: "Factual Associations" (e.g., Chicago)
* Blue dot with an X mark: "Associated Hallucinations" (e.g., Chicago)
* Red dot with an X mark: "Unassociated Hallucinations" (e.g., Tokyo)
* A speech bubble icon labeled "Generated Output"
### Detailed Analysis or ### Content Details
* **Factual Queries:** The queries are simple statements about Barack Obama, designed to elicit responses from the LLM.
* **LLM Processing:** The LLM block represents the internal processing of the queries.
* **Internal States:** The colored dots within the dashed rectangle visually represent the LLM's internal associations and potential errors. The green dots are clustered in the top portion, while the red dots are clustered in the bottom portion, with some blue dots mixed in the top portion.
* **Generated Output:** The legend explains the meaning of each color:
* Green dots represent correct factual associations.
* Blue dots represent hallucinations that are associated with the query context (e.g., a wrong city, but still a city).
* Red dots represent hallucinations that are not associated with the query context (e.g., a completely unrelated city).
### Key Observations
* The diagram visually separates correct factual associations from different types of hallucinations.
* The "Internal States" representation shows a clustering of factual associations (green) and unassociated hallucinations (red), suggesting a degree of separation in the LLM's internal representation.
* The examples provided in the legend clarify the distinction between associated and unassociated hallucinations.
### Interpretation
The diagram illustrates the challenges of ensuring factual accuracy in LLMs. It highlights that LLMs can generate not only correct information but also different types of incorrect information (hallucinations). The distinction between associated and unassociated hallucinations is important because it suggests different mechanisms for error generation. Associated hallucinations might arise from incorrect associations within the LLM's knowledge base, while unassociated hallucinations might stem from more random or unrelated sources. The diagram suggests that understanding and mitigating these different types of hallucinations is crucial for improving the reliability of LLMs.