## Scatter Plot: A-mem vs Base
### Overview
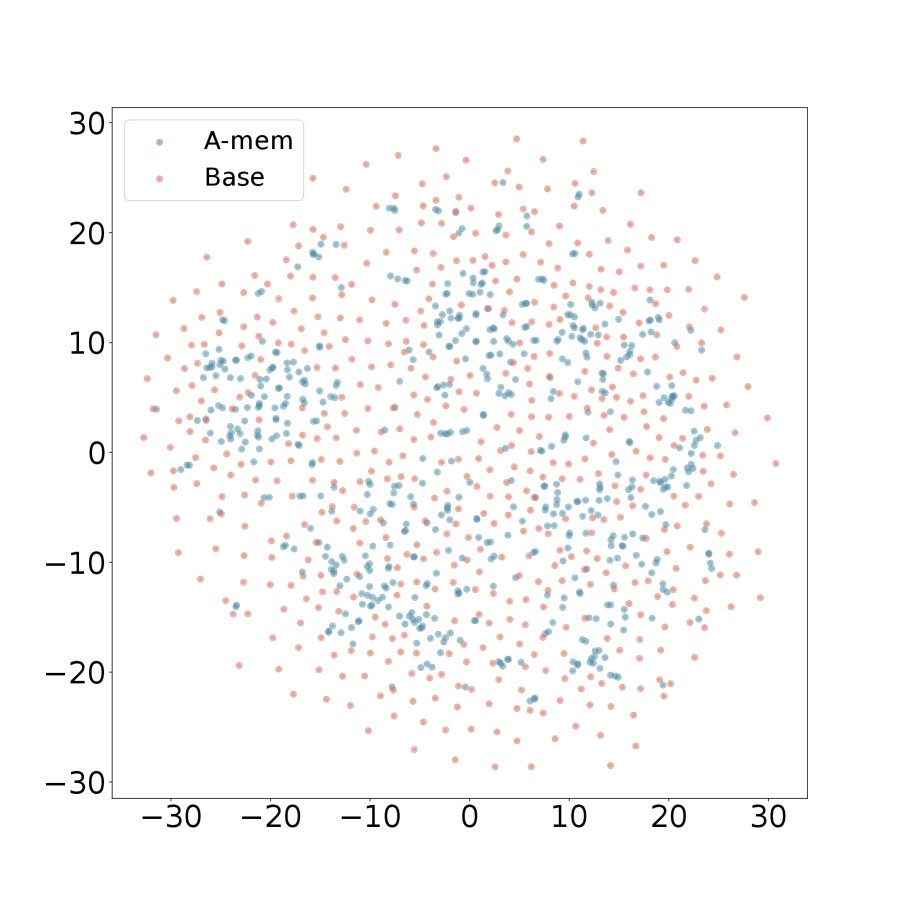
The image is a scatter plot comparing two datasets, labeled "A-mem" (shown in light blue) and "Base" (shown in light red). The plot displays the distribution of data points for each dataset across a two-dimensional space, with x and y axes ranging from approximately -30 to 30. The data points appear to be scattered somewhat randomly, with some areas showing a higher density of points.
### Components/Axes
* **X-axis:** Ranges from -30 to 30, with tick marks at -30, -20, -10, 0, 10, 20, and 30.
* **Y-axis:** Ranges from -30 to 30, with tick marks at -30, -20, -10, 0, 10, 20, and 30.
* **Legend:** Located in the top-left corner.
* "A-mem": Represented by light blue data points.
* "Base": Represented by light red data points.
### Detailed Analysis
* **A-mem (Light Blue):** The light blue data points are scattered throughout the plot. The density of points appears to be relatively uniform across the space, with a slight concentration around the center.
* **Base (Light Red):** The light red data points are also scattered throughout the plot. Similar to "A-mem", the density of points seems relatively uniform, with a slight concentration around the center.
### Key Observations
* Both datasets, "A-mem" and "Base", exhibit a similar distribution pattern.
* There is no clear clustering or separation between the two datasets.
* The data points are concentrated more towards the center of the plot.
### Interpretation
The scatter plot suggests that the "A-mem" and "Base" datasets have similar characteristics in the two-dimensional space represented by the x and y axes. The lack of distinct clusters or separation indicates that the two datasets are not easily distinguishable based on these two dimensions. The concentration of points towards the center might indicate a central tendency or a higher probability of data points occurring in that region for both datasets. Further analysis with additional dimensions or different visualization techniques might be needed to identify any significant differences between the two datasets.