## Chart: R1-Qwen Accuracy vs. Ratio
### Overview
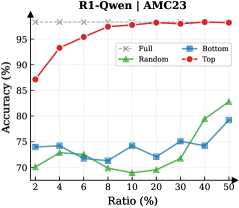
The image is a line chart comparing the accuracy of different methods (Full, Random, Bottom, Top) against varying ratios. The chart displays the relationship between the ratio (x-axis) and the accuracy (y-axis) for each method.
### Components/Axes
* **Title:** R1-Qwen | AMC23
* **X-axis:** Ratio (%) - Values: 2, 4, 6, 8, 10, 20, 30, 40, 50
* **Y-axis:** Accuracy (%) - Values range from 70 to 98, with gridlines at approximately 75, 80, 85, 90, and 95.
* **Legend:** Located at the top-right of the chart.
* Full (Gray dashed line with 'x' markers)
* Random (Green line with triangle markers)
* Bottom (Blue line with square markers)
* Top (Red line with circle markers)
### Detailed Analysis
* **Full:** The gray dashed line remains almost constant at approximately 98% accuracy across all ratios.
* **Random:** The green line starts at approximately 70% accuracy at a ratio of 2%, decreases slightly to around 68% at a ratio of 10%, and then increases to approximately 82% at a ratio of 50%.
* **Bottom:** The blue line starts at approximately 74% accuracy at a ratio of 2%, fluctuates between 71% and 75% until a ratio of 30%, and then increases to approximately 79% at a ratio of 50%.
* **Top:** The red line starts at approximately 87% accuracy at a ratio of 2%, increases sharply to approximately 93% at a ratio of 4%, and then gradually increases to approximately 98% at a ratio of 50%.
### Key Observations
* The "Full" method consistently achieves the highest accuracy across all ratios.
* The "Top" method shows a rapid increase in accuracy at lower ratios and then plateaus.
* The "Random" and "Bottom" methods have lower accuracy compared to "Full" and "Top," with "Random" showing more variability.
### Interpretation
The chart suggests that the "Full" method is the most reliable, maintaining high accuracy regardless of the ratio. The "Top" method is effective, especially at lower ratios. The "Random" and "Bottom" methods are less accurate and more sensitive to changes in the ratio. The data demonstrates the performance differences between these methods, highlighting the importance of method selection based on the specific ratio being considered.