## Scatter Plot with Trend Lines: Competition Level Accuracy (%)
### Overview
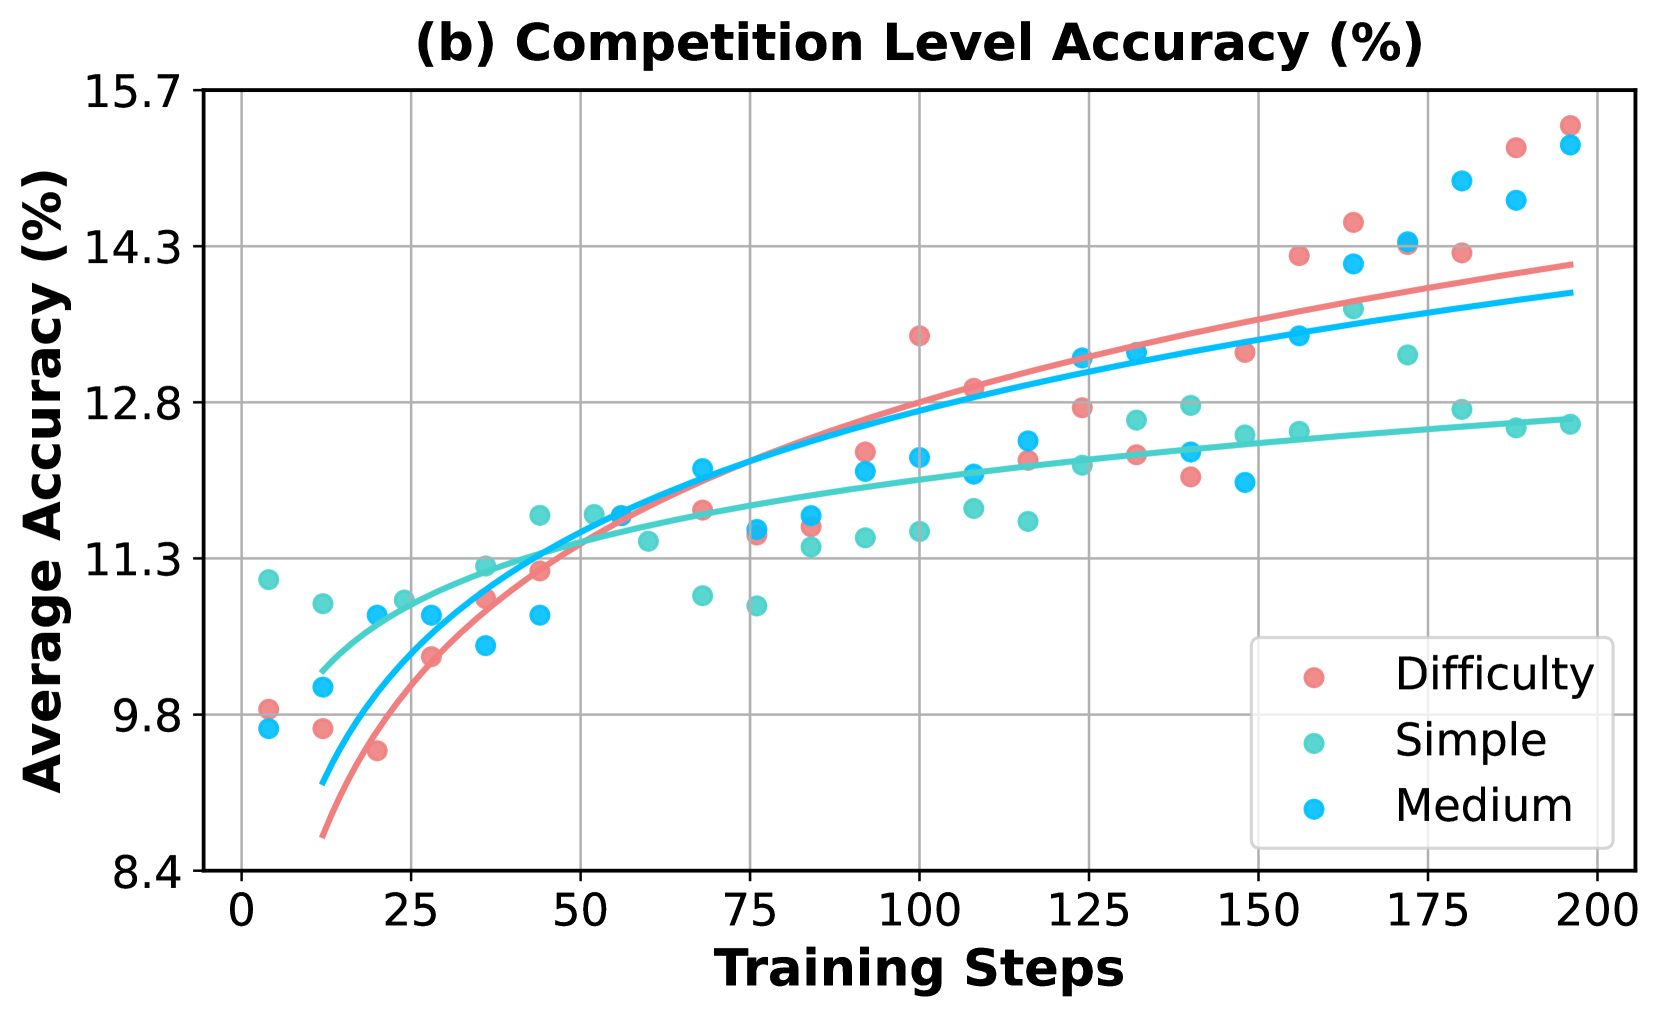
The image is a scatter plot with overlaid trend lines, titled "(b) Competition Level Accuracy (%)". It displays the relationship between the number of training steps (x-axis) and the average accuracy percentage (y-axis) for three different difficulty levels of tasks or competitions. The chart shows how model performance improves with training across these categories.
### Components/Axes
* **Title:** "(b) Competition Level Accuracy (%)" (centered at the top).
* **X-Axis:** Labeled "Training Steps". The scale runs from 0 to 200, with major tick marks at intervals of 25 (0, 25, 50, 75, 100, 125, 150, 175, 200).
* **Y-Axis:** Labeled "Average Accuracy (%)". The scale runs from 8.4 to 15.7, with major tick marks at intervals of 1.5 (8.4, 9.8, 11.3, 12.8, 14.3, 15.7).
* **Legend:** Located in the bottom-right corner of the plot area. It contains three entries:
* A red/salmon-colored circle labeled "Difficulty".
* A teal/green-colored circle labeled "Simple".
* A blue-colored circle labeled "Medium".
* **Data Series:** Three sets of scatter points, each with a corresponding smoothed trend line of the same color.
* **Grid:** A light gray grid is present, aligning with the major ticks on both axes.
### Detailed Analysis
**Trend Verification:**
* **Difficulty (Red/Salmon):** The trend line shows a strong, consistent upward slope, starting from the lowest accuracy at step 0 and ending at the highest accuracy at step 200.
* **Simple (Teal/Green):** The trend line slopes upward but begins to plateau significantly after approximately 100 training steps, showing the least overall improvement in the later stages.
* **Medium (Blue):** The trend line slopes upward steadily, positioned between the other two lines for most of the training progression.
**Data Point Extraction (Approximate Values):**
* **At ~0 Training Steps:**
* Difficulty: ~9.8%
* Simple: ~11.0%
* Medium: ~9.7%
* **At ~50 Training Steps:**
* Difficulty: ~11.2%
* Simple: ~11.6%
* Medium: ~11.4%
* **At ~100 Training Steps:**
* Difficulty: ~13.4% (a notable high point)
* Simple: ~11.6%
* Medium: ~12.2%
* **At ~150 Training Steps:**
* Difficulty: ~13.0%
* Simple: ~12.4%
* Medium: ~13.2%
* **At ~200 Training Steps (Final Points):**
* Difficulty: ~15.5% (highest final value)
* Simple: ~12.6% (lowest final value)
* Medium: ~15.3%
### Key Observations
1. **Performance Hierarchy Inversion:** At the start of training (step 0), the "Simple" category has the highest accuracy, while "Difficulty" and "Medium" are lower and similar. By the end of training (step 200), this order is inverted: "Difficulty" achieves the highest accuracy, followed closely by "Medium", with "Simple" now showing the lowest accuracy.
2. **Learning Curves:** The "Difficulty" series shows the steepest and most sustained learning curve. The "Simple" series learns quickly initially but hits a performance ceiling much earlier. The "Medium" series shows steady, consistent improvement throughout.
3. **Data Variance:** The scatter points for all series show variance around their trend lines, indicating fluctuations in accuracy between individual training steps. The "Difficulty" series appears to have slightly higher variance in the later stages (e.g., points at steps ~100 and ~160).
4. **Crossover Point:** The trend lines for "Difficulty" and "Medium" cross over the "Simple" trend line between 25 and 50 training steps, marking the point where they begin to consistently outperform the "Simple" tasks.
### Interpretation
This chart suggests that the model's ability to learn and improve is heavily influenced by task difficulty. While simpler tasks are mastered quickly, they offer less room for long-term improvement, leading to an early plateau. In contrast, more difficult tasks ("Difficulty" and "Medium") provide a richer learning signal, allowing the model to continue refining its performance over many more training steps. The fact that the "Difficulty" category ultimately yields the highest accuracy implies that the model's capacity is best utilized by challenging problems, and its performance on them scales well with extended training. This has implications for training strategies: allocating more training steps to harder tasks may be more beneficial for maximizing final model capability than focusing on easy tasks. The initial lower accuracy on hard tasks is expected, but the steep learning curve demonstrates effective knowledge acquisition.