## Combined Results: Equation Learning, Perception Accuracy, and Transfer Tasks
### Overview
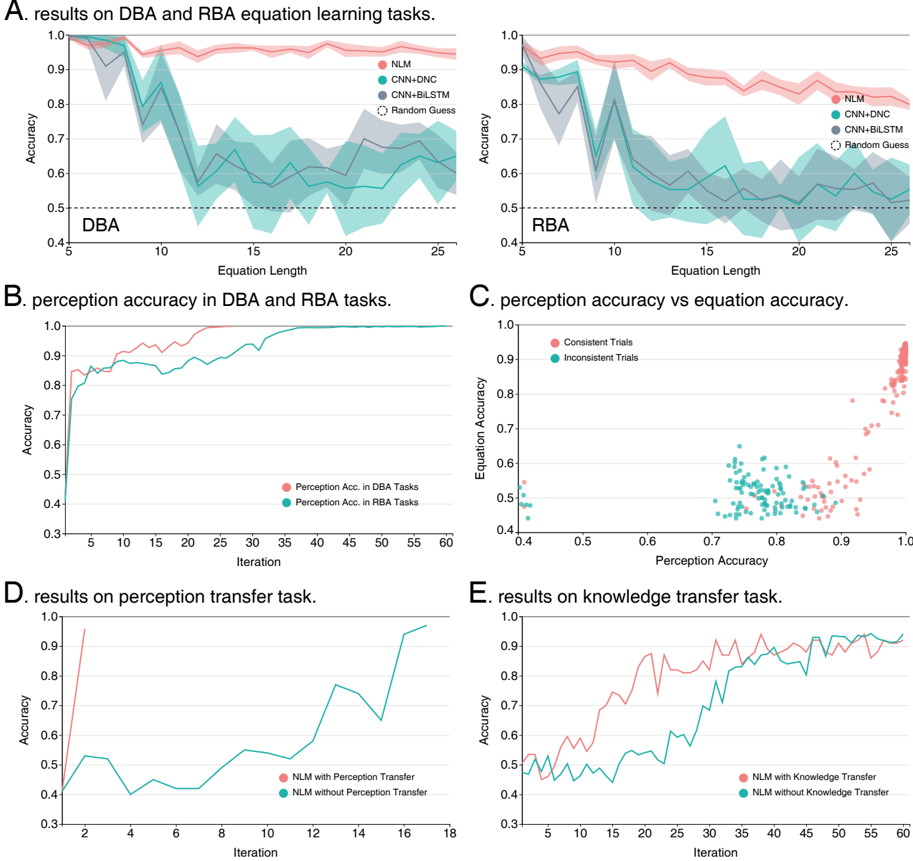
The image presents a series of five plots (A-E) that analyze the performance of different models on equation learning tasks, perception accuracy, and transfer learning tasks. The plots compare the accuracy of Neural Language Models (NLM) against other models like CNN+DNC and CNN+BiLSTM, and also examine the impact of perception and knowledge transfer on model performance.
### Components/Axes
**Plot A: Results on DBA and RBA equation learning tasks (Left)**
* **Title:** results on DBA and RBA equation learning tasks.
* **X-axis:** Equation Length (5 to 25)
* **Y-axis:** Accuracy (0.4 to 1.0)
* **Legend (Top-Right):**
* NLM (Red)
* CNN+DNC (Teal)
* CNN+BiLSTM (Dark Gray)
* Random Guess (Dashed Black)
* **Subplot Label:** DBA (Bottom-Left)
**Plot A: Results on DBA and RBA equation learning tasks (Right)**
* **Title:** results on DBA and RBA equation learning tasks.
* **X-axis:** Equation Length (5 to 25)
* **Y-axis:** Accuracy (0.4 to 1.0)
* **Legend (Top-Right):**
* NLM (Red)
* CNN+DNC (Teal)
* CNN+BiLSTM (Dark Gray)
* Random Guess (Dashed Black)
* **Subplot Label:** RBA (Bottom-Left)
**Plot B: Perception accuracy in DBA and RBA tasks.**
* **Title:** perception accuracy in DBA and RBA tasks.
* **X-axis:** Iteration (5 to 60, increments of 5)
* **Y-axis:** Accuracy (0.3 to 1.0)
* **Legend (Bottom):**
* Perception Acc. in DBA Tasks (Red)
* Perception Acc. in RBA Tasks (Teal)
**Plot C: Perception accuracy vs equation accuracy.**
* **Title:** perception accuracy vs equation accuracy.
* **X-axis:** Perception Accuracy (0.4 to 1.0)
* **Y-axis:** Equation Accuracy (0.4 to 1.0)
* **Legend (Top-Right):**
* Consistent Trials (Red)
* Inconsistent Trials (Teal)
**Plot D: Results on perception transfer task.**
* **Title:** results on perception transfer task.
* **X-axis:** Iteration (2 to 18, increments of 2)
* **Y-axis:** Accuracy (0.3 to 1.0)
* **Legend (Bottom):**
* NLM with Perception Transfer (Red)
* NLM without Perception Transfer (Teal)
**Plot E: Results on knowledge transfer task.**
* **Title:** results on knowledge transfer task.
* **X-axis:** Iteration (5 to 60, increments of 5)
* **Y-axis:** Accuracy (0.3 to 1.0)
* **Legend (Bottom):**
* NLM with Knowledge Transfer (Red)
* NLM without Knowledge Transfer (Teal)
### Detailed Analysis
**Plot A (DBA):**
* **NLM (Red):** Starts at approximately 1.0 accuracy, drops sharply to around 0.8 at equation length 7, then fluctuates between 0.8 and 0.9 with increasing equation length.
* **CNN+DNC (Teal):** Starts at approximately 0.95 accuracy, drops sharply to around 0.55 at equation length 7, then gradually increases to around 0.65 with increasing equation length.
* **CNN+BiLSTM (Dark Gray):** Data not clearly visible.
* **Random Guess (Dashed Black):** Constant accuracy at approximately 0.5.
**Plot A (RBA):**
* **NLM (Red):** Starts at approximately 0.95 accuracy, gradually decreases to around 0.85 with increasing equation length.
* **CNN+DNC (Teal):** Starts at approximately 0.9 accuracy, drops sharply to around 0.5 at equation length 7, then gradually increases to around 0.55 with increasing equation length.
* **CNN+BiLSTM (Dark Gray):** Data not clearly visible.
* **Random Guess (Dashed Black):** Constant accuracy at approximately 0.5.
**Plot B:**
* **Perception Acc. in DBA Tasks (Red):** Starts at approximately 0.8 accuracy, increases sharply to around 0.95 by iteration 10, and then plateaus at approximately 1.0.
* **Perception Acc. in RBA Tasks (Teal):** Starts at approximately 0.4 accuracy, increases sharply to around 0.9 by iteration 15, and then plateaus at approximately 1.0.
**Plot C:**
* **Consistent Trials (Red):** Clusters in two regions: one around (0.4, 0.5) and another along the upper-right corner, showing a positive correlation between perception accuracy and equation accuracy.
* **Inconsistent Trials (Teal):** Clusters primarily in the region where perception accuracy is between 0.7 and 0.9, and equation accuracy is between 0.5 and 0.7.
**Plot D:**
* **NLM with Perception Transfer (Red):** Starts at approximately 0.95 accuracy, drops sharply to around 0.4 at iteration 2.
* **NLM without Perception Transfer (Teal):** Starts at approximately 0.4 accuracy, fluctuates between 0.4 and 0.8, and then increases sharply to around 1.0 at iteration 16.
**Plot E:**
* **NLM with Knowledge Transfer (Red):** Starts at approximately 0.5 accuracy, increases gradually to around 0.9 by iteration 35, and then fluctuates between 0.9 and 1.0.
* **NLM without Knowledge Transfer (Teal):** Starts at approximately 0.5 accuracy, increases gradually to around 0.9 by iteration 40, and then fluctuates between 0.9 and 1.0.
### Key Observations
* In equation learning tasks (Plot A), NLM generally outperforms CNN+DNC, especially for longer equations.
* Perception accuracy in both DBA and RBA tasks (Plot B) improves significantly with iteration, eventually reaching near-perfect accuracy.
* Plot C shows a positive correlation between perception accuracy and equation accuracy for consistent trials.
* Perception transfer (Plot D) initially hinders performance but eventually leads to higher accuracy.
* Knowledge transfer (Plot E) improves the learning rate and overall accuracy of the NLM.
### Interpretation
The data suggests that NLM is a more effective model for equation learning tasks compared to CNN+DNC, particularly as equation length increases. The improvement in perception accuracy with iteration indicates that the models are learning to better interpret the input data. The positive correlation between perception and equation accuracy highlights the importance of accurate perception for successful equation solving. The impact of perception and knowledge transfer on model performance demonstrates the potential for transfer learning to enhance the learning process. The initial dip in accuracy with perception transfer may indicate an initial adjustment period as the model integrates the transferred knowledge.