\n
## Image Analysis: Heatmap Comparison of Attention Mechanisms
### Overview
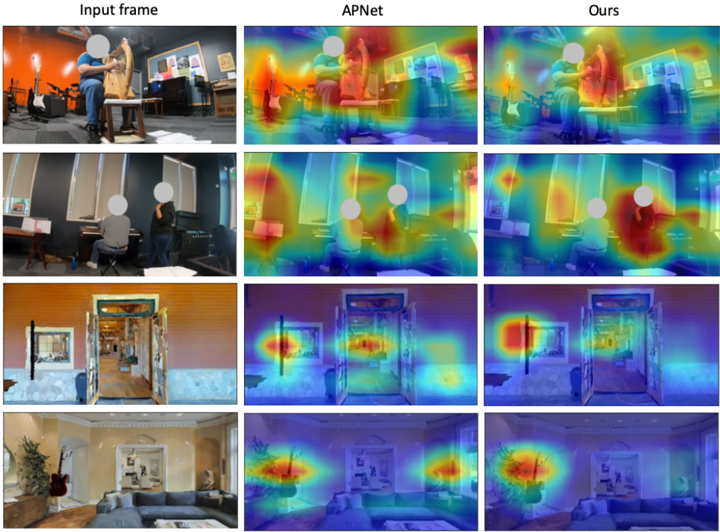
The image presents a comparative analysis of attention mechanisms applied to four different input images. Three columns display the results: "Input frame" (the original image), "APNet" (attention map generated by the APNet model), and "Ours" (attention map generated by a different, unnamed model). Each row represents a different scene. The attention maps are visualized as heatmaps overlaid on the original images, with warmer colors (red, orange, yellow) indicating higher attention and cooler colors (blue, purple) indicating lower attention.
### Components/Axes
The image is structured as a 4x3 grid.
- **Columns:**
- "Input frame": Original image.
- "APNet": Attention map generated by the APNet model.
- "Ours": Attention map generated by the proposed model.
- **Rows:** Four distinct scenes are presented.
- **Heatmap Color Scale:** The heatmap uses a gradient from blue (low attention) to red (high attention), passing through purple, indigo, green, yellow, and orange. There are no explicit numerical values associated with the color scale.
### Detailed Analysis or Content Details
The image does not contain numerical data. The analysis focuses on the visual distribution of attention in each heatmap.
**Row 1:**
- **Input frame:** Shows a person working at a computer in an office setting.
- **APNet:** Highlights the person's head and upper body, with some attention on the computer screen.
- **Ours:** Highlights the person's head and upper body more distinctly, with a more focused attention on the face and hands.
**Row 2:**
- **Input frame:** Shows a person sitting at a desk, possibly reading or writing.
- **APNet:** Highlights the person's head and upper body, with some attention on the desk area.
- **Ours:** Highlights the person's head and upper body with greater clarity, and also focuses attention on the hands and the objects on the desk.
**Row 3:**
- **Input frame:** Shows a doorway and a hallway.
- **APNet:** Highlights the doorway and the area immediately around it.
- **Ours:** Highlights the doorway and the hallway more broadly, with a more even distribution of attention.
**Row 4:**
- **Input frame:** Shows a living room with a sofa and a wall with decorations.
- **APNet:** Highlights the sofa and the wall decorations.
- **Ours:** Highlights the sofa and the wall decorations with a more focused attention on the central area of the sofa.
### Key Observations
- The "Ours" model consistently produces more focused and detailed attention maps compared to the "APNet" model.
- Both models tend to focus attention on people when they are present in the scene.
- The "Ours" model appears to be better at identifying and highlighting specific objects within a scene.
- The attention maps are not simply highlighting the brightest or most visually salient areas of the image; they seem to be focusing on semantically relevant regions.
### Interpretation
The image demonstrates a comparison of two attention mechanisms, "APNet" and "Ours," in terms of their ability to focus on relevant regions of an image. The heatmaps suggest that the "Ours" model is more effective at capturing the salient features of a scene and directing attention to the most important objects or regions. This could be due to differences in the model architecture, training data, or optimization techniques. The consistent improvement of "Ours" across different scenes suggests a more robust and generalizable attention mechanism. The fact that attention is focused on people and objects, rather than just bright areas, indicates that the models are learning to understand the semantic content of the images. This is crucial for tasks such as object detection, image captioning, and visual question answering. The image provides qualitative evidence that the "Ours" model is a promising approach for improving attention mechanisms in computer vision.