## Circular Diagram: Math Concepts
### Overview
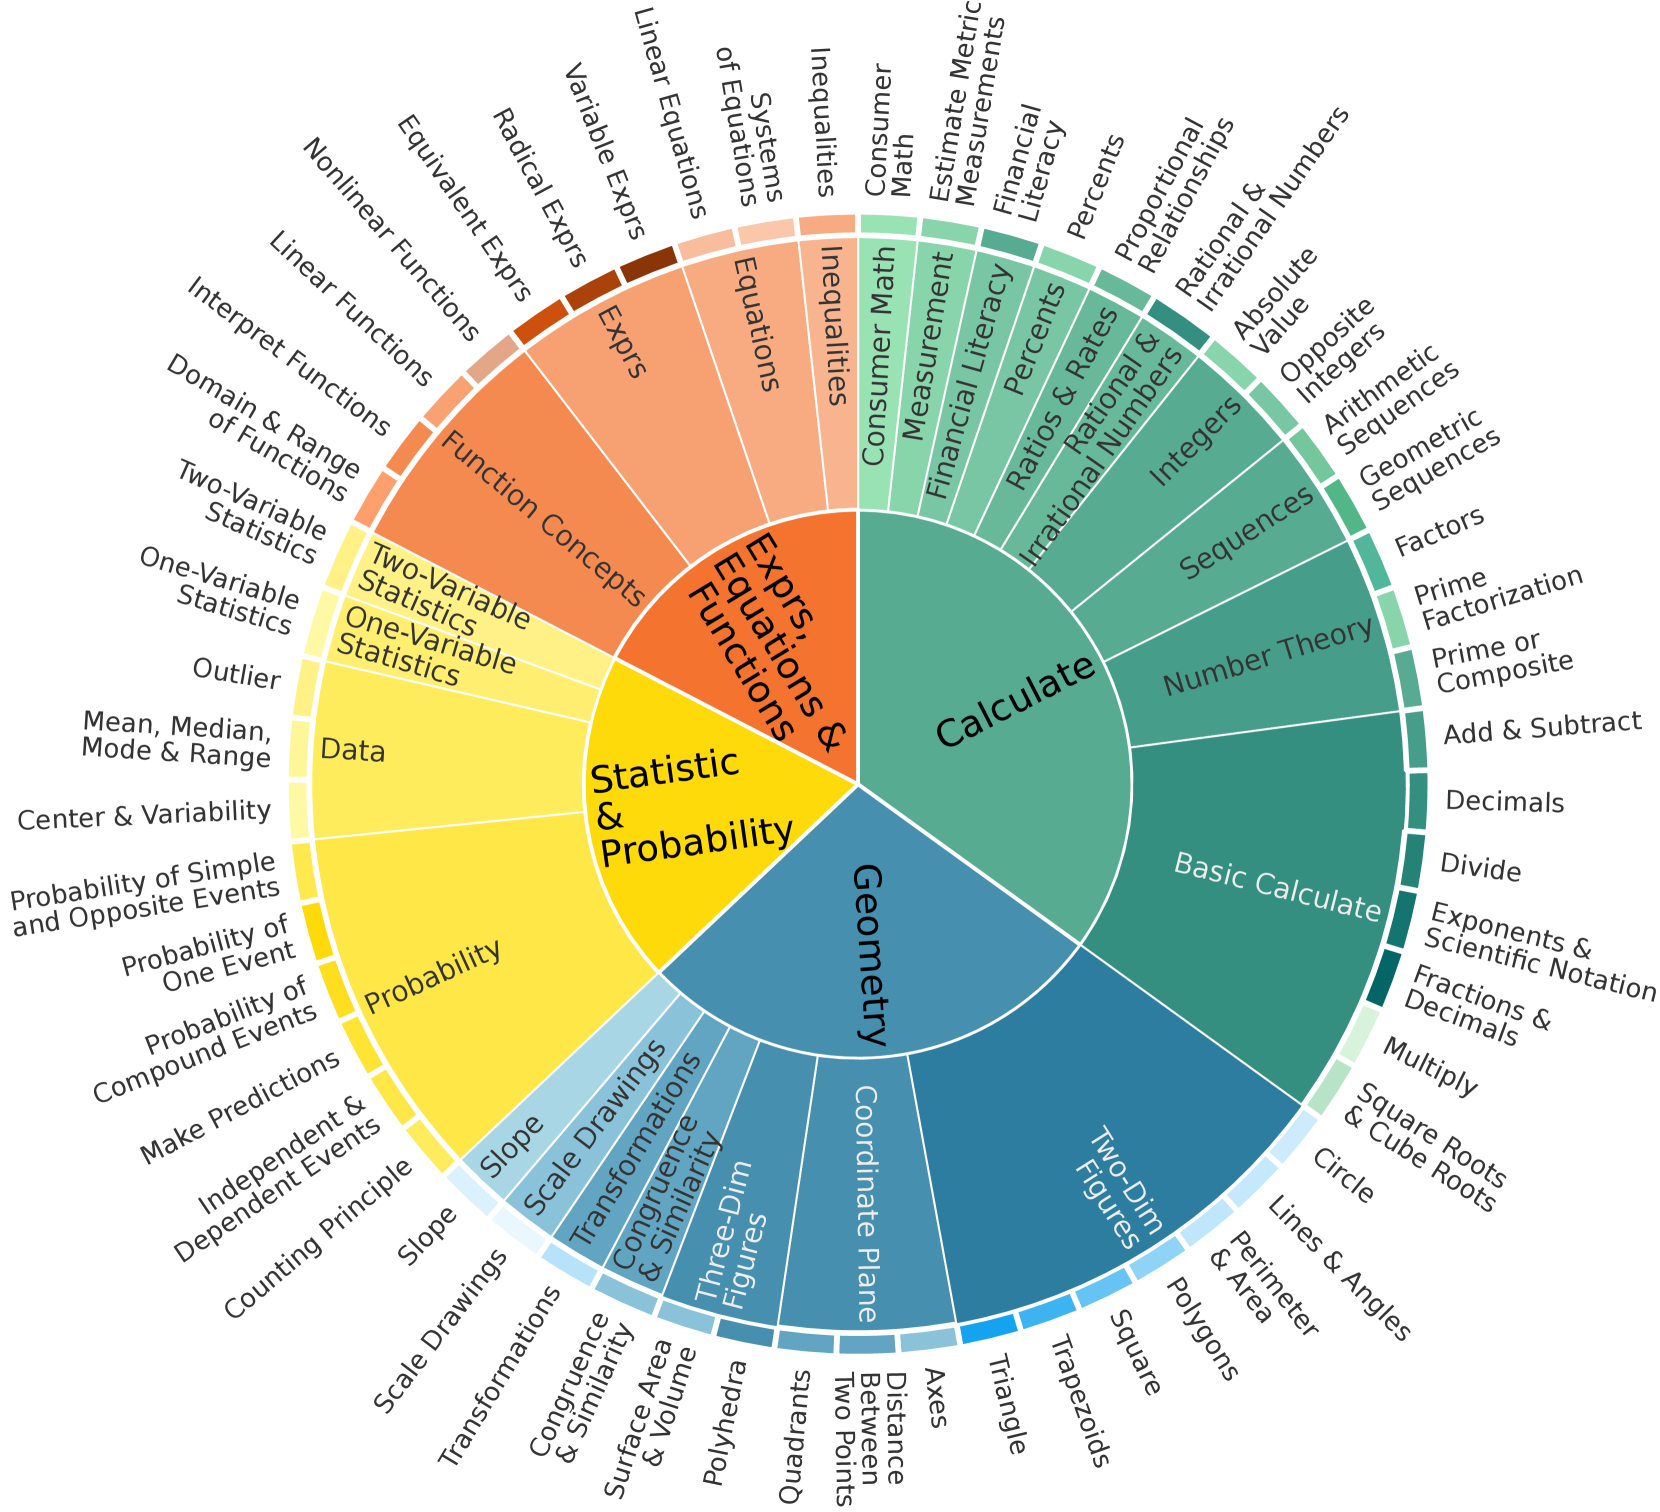
The image is a circular diagram illustrating various mathematical concepts, categorized into broader areas like "Exprs, Equations & Functions," "Statistic & Probability," "Geometry," and "Calculate." The diagram uses color-coding to visually group related concepts.
### Components/Axes
The diagram is structured as a series of concentric rings, with the central area containing the most general categories and the outer rings containing more specific sub-categories.
* **Central Categories:**
* Exprs, Equations & Functions (Orange)
* Statistic & Probability (Yellow)
* Geometry (Blue)
* Calculate (Green)
* **Outer Rings:** Contain specific mathematical concepts related to the central categories.
### Detailed Analysis or Content Details
**1. Exprs, Equations & Functions (Orange):**
* **Outermost Ring (Darkest Orange to Lightest Orange):**
* Linear Equations
* Variable Exprs
* Radical Exprs
* Equivalent Exprs
* Systems of Equations
* Equations
* Inequalities
* **Middle Ring:**
* Nonlinear Functions
* Linear Functions
* Interpret Functions
* Domain & Range of Functions
* Function Concepts
* **Innermost Ring:**
* Two-Variable Statistics
* One-Variable Statistics
**2. Statistic & Probability (Yellow):**
* **Outermost Ring:**
* Outlier
* Mean, Median, Mode & Range
* Center & Variability
* Probability of Simple and Opposite Events
* Probability of One Event
* Probability of Compound Events
* Make Predictions
* Independent & Dependent Events
* Counting Principle
* **Middle Ring:**
* Data
* Probability
* **Innermost Ring:**
* Two-Variable Statistics
* One-Variable Statistics
**3. Geometry (Blue):**
* **Outermost Ring (Darkest Blue to Lightest Blue):**
* Slope
* Scale Drawings
* Transformations
* Congruence & Similarity
* Three-Dim Figures
* Surface Area & Volume
* Polyhedra
* Quadrants
* Distance Between Two Points
* Axes
* Triangle
* Trapezoids
* Square
* Polygons
* Perimeter & Area
* Lines & Angles
* Circle
* Two-Dim Figures
* **Middle Ring:**
* Coordinate Plane
**4. Calculate (Green):**
* **Outermost Ring (Darkest Green to Lightest Green):**
* Consumer Math
* Measurement
* Estimate Metric Measurements
* Financial Literacy
* Percents
* Ratios & Rates
* Proportional Relationships
* Rational & Irrational Numbers
* Integers
* Absolute Value
* Opposite Integers
* Arithmetic Sequences
* Geometric Sequences
* Factors
* Prime Factorization
* Prime or Composite
* Add & Subtract
* Decimals
* Divide
* Exponents & Scientific Notation
* Fractions & Decimals
* Multiply
* Square Roots & Cube Roots
* **Middle Ring:**
* Irrational Numbers
* Sequences
* Number Theory
* Basic Calculate
### Key Observations
* The diagram provides a hierarchical organization of mathematical concepts.
* The color-coding helps to visually group related concepts.
* The level of detail increases from the center to the outer rings.
### Interpretation
The circular diagram serves as a visual aid for understanding the relationships between different mathematical concepts. It demonstrates how specific topics like "Linear Equations" and "Slope" fit into broader categories like "Exprs, Equations & Functions" and "Geometry," respectively. The diagram is useful for students or anyone seeking a high-level overview of mathematical topics and their interconnections. The arrangement suggests a progression of learning, starting with fundamental concepts and moving towards more specialized areas.