\n
## Line Chart: Training Batch Accuracy (%)
### Overview
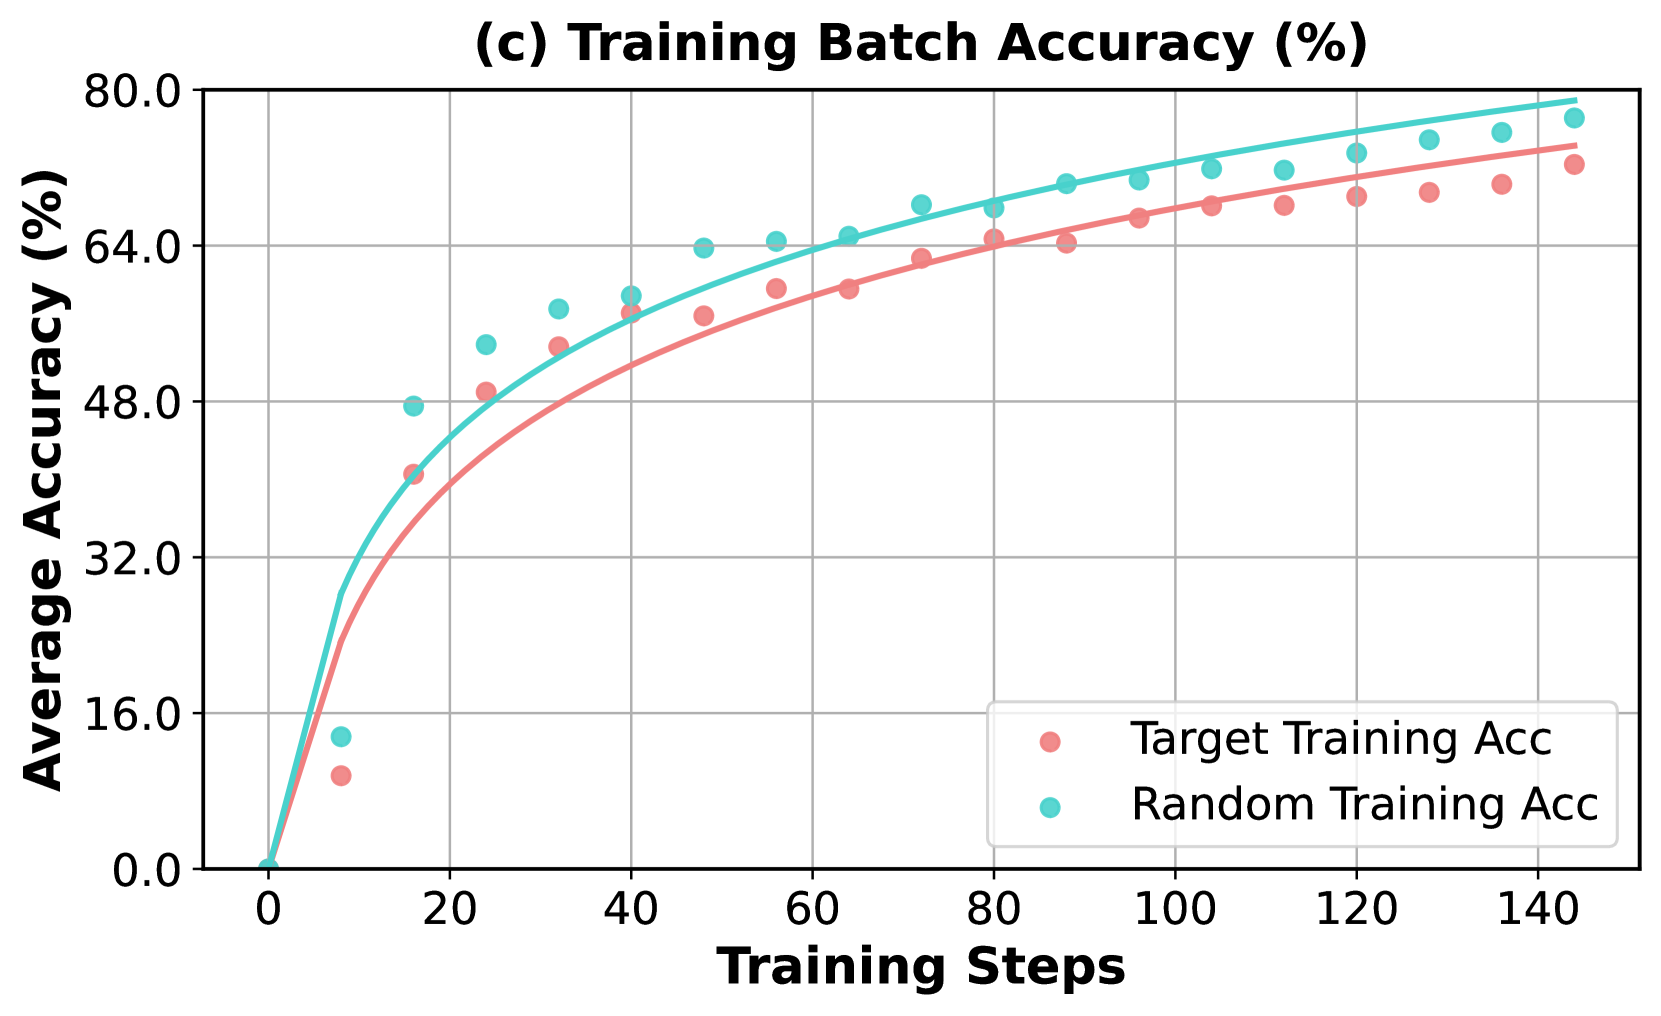
This image presents a line chart illustrating the average accuracy (%) of two training methods – "Target Training Acc" and "Random Training Acc" – over a series of training steps. The chart aims to compare the performance of these two methods during the training process.
### Components/Axes
* **Title:** "(c) Training Batch Accuracy (%)" – positioned at the top-center of the chart.
* **X-axis:** "Training Steps" – ranging from approximately 0 to 140, with tick marks at intervals of 20.
* **Y-axis:** "Average Accuracy (%)" – ranging from 0.0 to 80.0, with tick marks at intervals of 16.
* **Legend:** Located in the bottom-right corner of the chart.
* "Target Training Acc" – represented by red circles.
* "Random Training Acc" – represented by teal circles.
* **Data Series:** Two lines representing the accuracy of each training method.
### Detailed Analysis
**Target Training Acc (Red Line):**
The red line representing "Target Training Acc" starts at approximately 8% accuracy at 0 training steps. It exhibits a steep upward slope initially, reaching around 40% accuracy at 20 training steps. The slope gradually decreases, and the line plateaus around 68% accuracy between 80 and 140 training steps.
* (0, 8%)
* (20, 40%)
* (40, 56%)
* (60, 62%)
* (80, 66%)
* (100, 68%)
* (120, 69%)
* (140, 70%)
**Random Training Acc (Teal Line):**
The teal line representing "Random Training Acc" begins at approximately 1% accuracy at 0 training steps. It also shows a steep initial increase, reaching around 48% accuracy at 20 training steps. The slope then decreases, and the line approaches a plateau around 76% accuracy between 80 and 140 training steps.
* (0, 1%)
* (20, 48%)
* (40, 60%)
* (60, 68%)
* (80, 74%)
* (100, 76%)
* (120, 77%)
* (140, 78%)
### Key Observations
* Both training methods demonstrate increasing accuracy with more training steps.
* "Random Training Acc" consistently outperforms "Target Training Acc" throughout the training process.
* The rate of accuracy improvement diminishes for both methods as training progresses, indicating a potential convergence towards a maximum accuracy level.
* The "Target Training Acc" line appears to flatten out more significantly than the "Random Training Acc" line, suggesting it may be reaching its performance limit sooner.
### Interpretation
The chart suggests that the "Random Training Acc" method is more effective at achieving higher accuracy during the training process compared to the "Target Training Acc" method. The initial steep increase in accuracy for both methods indicates rapid learning in the early stages of training. The subsequent flattening of the curves suggests that the models are approaching their maximum achievable accuracy, and further training may yield diminishing returns. The consistent superiority of "Random Training Acc" could be due to a more effective exploration of the solution space or a better adaptation to the training data. The difference in performance between the two methods highlights the importance of selecting an appropriate training strategy to optimize model accuracy. The data suggests that the "Target Training Acc" method may benefit from adjustments to its parameters or architecture to improve its performance.