\n
## Diagram: Decision Tree / State Diagram
### Overview
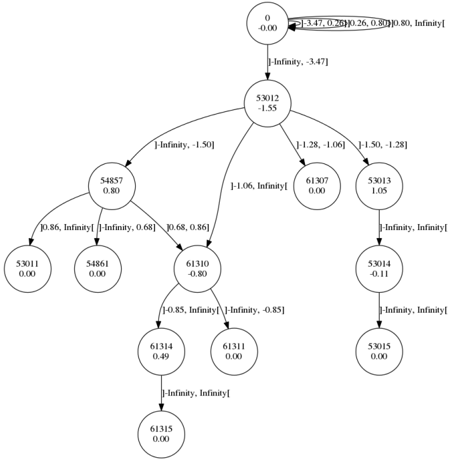
The image depicts a directed acyclic graph, resembling a decision tree or state diagram. Nodes are represented as circles containing numerical identifiers and associated values. Arrows indicate transitions between nodes, with associated interval values labeled on the arrows. The diagram appears to represent a branching process, potentially a classification or decision-making algorithm.
### Components/Axes
The diagram consists of nodes and directed edges. Each node has:
* **Identifier:** A numerical value (e.g., 0, 53012, 54857).
* **Value:** A decimal number (e.g., 0.00, -1.55, 0.80).
Each edge has:
* **Interval:** A pair of values enclosed in square brackets, representing a range (e.g., [-Infinity, -1.50], [-1.28, 0.68]).
### Detailed Analysis / Content Details
The diagram can be described level by level, starting from the root node:
* **Node 0:** Identifier 0, Value 0.00. Has two outgoing edges.
* Edge 1: Interval [-3.47, 0.26] leads to Node 53012.
* Edge 2: Interval [0.80, Infinity] leads to Node 54857.
* **Node 53012:** Identifier 53012, Value -1.55. Has one outgoing edge.
* Edge 3: Interval [-Infinity, -1.50] leads to Node 54857.
* **Node 54857:** Identifier 54857, Value 0.80. Has two outgoing edges.
* Edge 4: Interval [0.86, Infinity] leads to Node 53011.
* Edge 5: Interval [-Infinity, 0.68] leads to Node 61310.
* **Node 61307:** Identifier 61307, Value 0.00. Has one outgoing edge.
* Edge 6: Interval [-1.28, Infinity] leads to Node 53013.
* **Node 53013:** Identifier 53013, Value 1.05. Has one outgoing edge.
* Edge 7: Interval [-Infinity, Infinity] leads to Node 53014.
* **Node 53014:** Identifier 53014, Value -0.11. Has one outgoing edge.
* Edge 8: Interval [-Infinity, Infinity] leads to Node 53015.
* **Node 53015:** Identifier 53015, Value 0.00.
* **Node 61310:** Identifier 61310, Value -0.80. Has two outgoing edges.
* Edge 9: Interval [0.68, 0.86] leads to Node 61314.
* Edge 10: Interval [-Infinity, -0.85] leads to Node 61311.
* **Node 61311:** Identifier 61311, Value 0.00.
* **Node 61314:** Identifier 61314, Value 0.49. Has one outgoing edge.
* Edge 11: Interval [-Infinity, Infinity] leads to Node 61315.
* **Node 61315:** Identifier 61315, Value 0.00.
* **Node 53011:** Identifier 53011, Value 0.00.
* **Node 54861:** Identifier 54861, Value 0.00.
### Key Observations
* The diagram is a tree structure, starting from node 0 and branching out.
* The interval values on the edges define the conditions for transitioning between nodes.
* Several nodes have a value of 0.00, suggesting they might represent terminal states or default values.
* The intervals often include -Infinity or Infinity, indicating unbounded ranges.
* Node 54857 appears as a convergence point, being reached from both node 0 and node 53012.
### Interpretation
This diagram likely represents a decision-making process or a classification algorithm. The nodes represent states or decisions, and the edges represent transitions based on certain conditions (defined by the intervals). The values associated with the nodes could represent probabilities, scores, or other relevant metrics.
The presence of -Infinity and Infinity in the intervals suggests that the algorithm can handle a wide range of input values. The convergence of paths at node 54857 indicates that different initial conditions can lead to the same state. The terminal nodes (with values of 0.00) likely represent the final outcomes or classifications.
Without further context, it's difficult to determine the specific purpose of this diagram. However, it provides a clear visual representation of a branching process with well-defined conditions and outcomes. The diagram could be used to model a variety of real-world scenarios, such as medical diagnosis, financial risk assessment, or machine learning classification. The values associated with each node could be used to quantify the confidence or certainty of each decision.