## Line Chart: Surprisal vs. Training Steps
### Overview
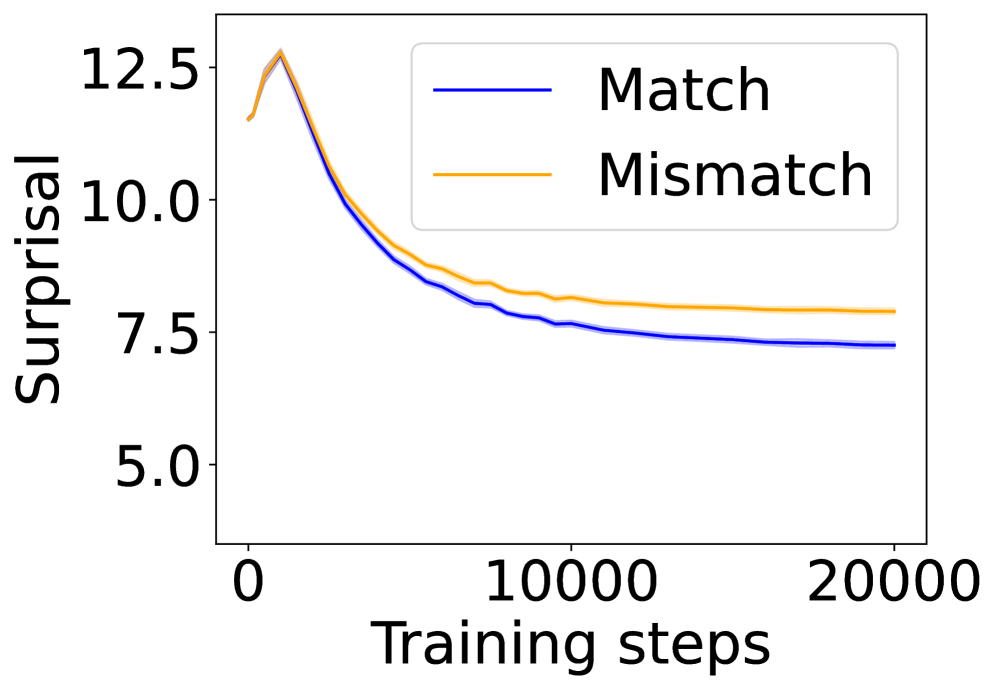
The image is a line chart that plots "Surprisal" against "Training steps". Two data series are displayed: "Match" (blue line) and "Mismatch" (orange line). Both lines show a decreasing trend in surprisal as training steps increase, eventually plateauing. Shaded regions around each line likely represent confidence intervals or standard deviations.
### Components/Axes
* **X-axis:** "Training steps", ranging from 0 to 20000, with a major tick at 10000.
* **Y-axis:** "Surprisal", ranging from 5.0 to 12.5, with major ticks at 5.0, 7.5, 10.0, and 12.5.
* **Legend:** Located in the top-right corner, it identifies the blue line as "Match" and the orange line as "Mismatch".
* **Data Series:**
* Match (blue line)
* Mismatch (orange line)
### Detailed Analysis
* **Match (blue line):**
* Trend: Decreases sharply initially, then plateaus.
* Approximate values:
* At 0 training steps, surprisal is approximately 12.0.
* At 10000 training steps, surprisal is approximately 7.7.
* At 20000 training steps, surprisal is approximately 7.2.
* **Mismatch (orange line):**
* Trend: Decreases sharply initially, then plateaus.
* Approximate values:
* At 0 training steps, surprisal is approximately 11.8.
* At 10000 training steps, surprisal is approximately 8.3.
* At 20000 training steps, surprisal is approximately 7.8.
### Key Observations
* Both "Match" and "Mismatch" surprisal values decrease as the number of training steps increases.
* The "Mismatch" line is consistently above the "Match" line, indicating higher surprisal values for mismatched data throughout the training process.
* The rate of decrease in surprisal is higher in the initial training steps (0-5000) for both data series.
* The shaded regions around the lines suggest some variability in the surprisal values, but the overall trends are clear.
### Interpretation
The chart illustrates how surprisal, a measure of unexpectedness or uncertainty, changes during the training of a model. The decreasing surprisal values for both "Match" and "Mismatch" conditions indicate that the model is learning to better predict or understand the data as it is exposed to more training examples. The fact that "Mismatch" surprisal remains higher than "Match" surprisal suggests that the model still finds mismatched data more surprising, even after extensive training. This could indicate that the model is better at processing or predicting matched data, or that the mismatched data contains inherent complexities or noise that make it harder to learn. The plateauing of the lines suggests that the model's learning has reached a point of diminishing returns, where further training does not significantly reduce surprisal.