\n
## Line Chart: Surprisal vs. Training Steps
### Overview
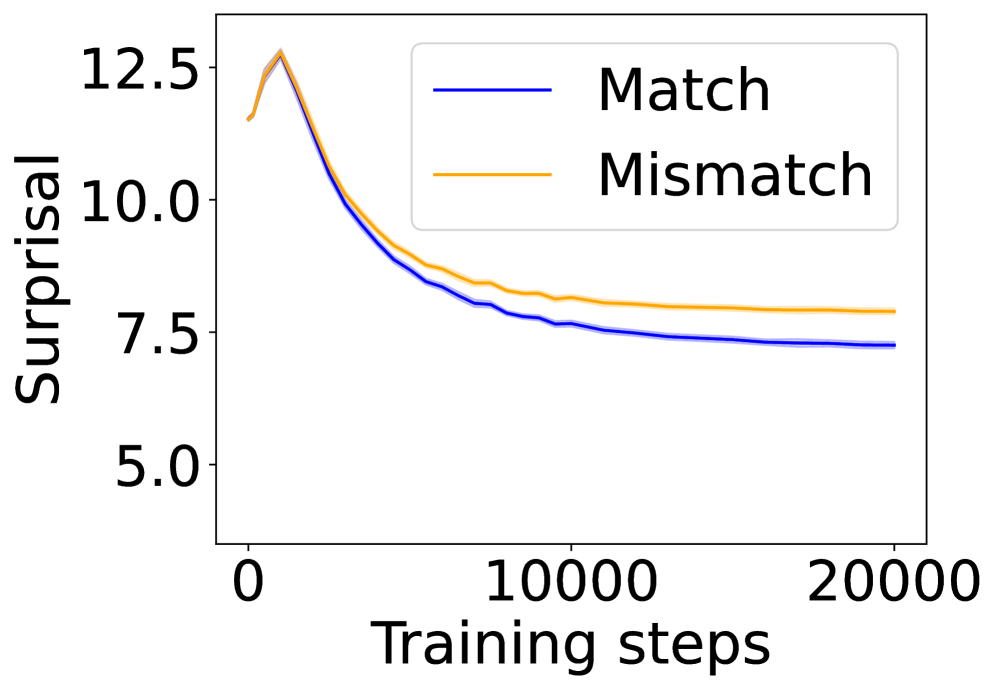
The image is a line chart plotting "Surprisal" against "Training steps" for two conditions: "Match" and "Mismatch". It visualizes how a model's surprisal (a measure of prediction uncertainty or information content) changes over the course of training. Both conditions show a rapid initial decrease in surprisal, which then plateaus, with the "Mismatch" condition consistently maintaining a higher surprisal value than the "Match" condition.
### Components/Axes
* **Chart Type:** Line chart with two data series.
* **X-Axis:**
* **Label:** "Training steps"
* **Scale:** Linear scale.
* **Markers:** 0, 10000, 20000.
* **Y-Axis:**
* **Label:** "Surprisal"
* **Scale:** Linear scale.
* **Markers:** 5.0, 7.5, 10.0, 12.5.
* **Legend:**
* **Position:** Top-right corner of the plot area.
* **Series 1:** "Match" - Represented by a solid blue line.
* **Series 2:** "Mismatch" - Represented by a solid orange line.
### Detailed Analysis
**Trend Verification:**
* **Match (Blue Line):** The line exhibits a steep downward slope from the start, which gradually flattens out. It is consistently positioned below the orange line throughout the entire x-axis range.
* **Mismatch (Orange Line):** This line follows a nearly identical shape to the blue line—a steep initial decline followed by a plateau—but is offset vertically, remaining above the blue line at all points.
**Data Point Extraction (Approximate Values):**
* **At Step 0:** Both lines start at approximately the same point, near a Surprisal value of **12.5**.
* **At Step ~5000 (estimated):**
* Match: ~8.5
* Mismatch: ~9.0
* **At Step 10000:**
* Match: ~7.5
* Mismatch: ~8.0
* **At Step 20000:**
* Match: ~7.2
* Mismatch: ~7.8
**Key Observations:**
1. **Parallel Trajectories:** The two lines are nearly parallel after the initial drop, indicating the *rate* of surprisal reduction is similar for both conditions after the early training phase.
2. **Persistent Gap:** A consistent gap of approximately **0.5 to 0.6** surprisal units is maintained between the "Mismatch" and "Match" conditions from around step 5000 onward.
3. **Convergence Behavior:** Both curves show clear convergence, with the slope approaching zero by step 20000, suggesting the model's performance on this metric has stabilized.
4. **Initial Peak:** There is a very brief initial increase or peak at the very start (step 0) before the decline begins.
### Interpretation
This chart demonstrates a fundamental learning dynamic. The rapid decrease in surprisal for both conditions indicates the model is effectively learning from the training data, becoming less "surprised" by it over time.
The critical finding is the persistent performance gap. The "Mismatch" condition results in consistently higher surprisal, meaning the model finds data under this condition less predictable or more informative than data under the "Match" condition. This suggests that whatever experimental variable "Mismatch" represents (e.g., out-of-distribution data, adversarial examples, or a corrupted input condition) creates a lasting difficulty for the model that is not fully overcome by training, even as overall performance improves.
The parallel nature of the curves after the initial phase implies that the core learning mechanism operates similarly in both scenarios, but the "Mismatch" data starts from and remains at a higher baseline of difficulty. The chart effectively quantifies the "cost" or "penalty" associated with the mismatch condition in terms of the model's predictive uncertainty.