## Line Chart: Model Calibration and Performance vs. Sample Size
### Overview
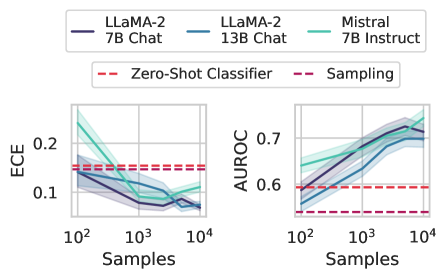
The image presents two line charts comparing the calibration and performance of different Large Language Models (LLMs) – LLaMA-2 (7B Chat and 13B Chat) and Mistral (7B Instruct) – as a function of the number of samples used. The left chart displays Expected Calibration Error (ECE), while the right chart shows Area Under the Receiver Operating Characteristic curve (AUROC). Both charts include baseline performance metrics for Zero-Shot Classifier and Sampling methods.
### Components/Axes
* **X-axis (Both Charts):** "Samples" - Logarithmic scale, ranging from 10<sup>2</sup> to 10<sup>4</sup>.
* **Left Chart Y-axis:** "ECE" - Ranging from 0.0 to 0.25.
* **Right Chart Y-axis:** "AUROC" - Ranging from 0.5 to 0.8.
* **Legend (Top-Center):**
* LLaMA-2 7B Chat (Dark Blue Solid Line)
* LLaMA-2 13B Chat (Light Blue Solid Line)
* Mistral 7B Instruct (Teal Solid Line)
* Zero-Shot Classifier (Red Dashed Line)
* Sampling (Red Dashed Line)
### Detailed Analysis or Content Details
**Left Chart (ECE):**
* **LLaMA-2 7B Chat (Dark Blue):** Starts at approximately ECE = 0.22 at 10<sup>2</sup> samples, decreases to approximately ECE = 0.09 at 10<sup>3</sup> samples, and stabilizes around ECE = 0.08 at 10<sup>4</sup> samples.
* **LLaMA-2 13B Chat (Light Blue):** Starts at approximately ECE = 0.21 at 10<sup>2</sup> samples, decreases to approximately ECE = 0.09 at 10<sup>3</sup> samples, and stabilizes around ECE = 0.08 at 10<sup>4</sup> samples.
* **Mistral 7B Instruct (Teal):** Starts at approximately ECE = 0.23 at 10<sup>2</sup> samples, decreases to approximately ECE = 0.11 at 10<sup>3</sup> samples, and stabilizes around ECE = 0.09 at 10<sup>4</sup> samples.
* **Zero-Shot Classifier (Red Dashed):** Horizontal line at approximately ECE = 0.16.
* **Sampling (Red Dashed):** Horizontal line at approximately ECE = 0.16.
**Right Chart (AUROC):**
* **LLaMA-2 7B Chat (Dark Blue):** Starts at approximately AUROC = 0.62 at 10<sup>2</sup> samples, increases to approximately AUROC = 0.72 at 10<sup>3</sup> samples, and stabilizes around AUROC = 0.74 at 10<sup>4</sup> samples.
* **LLaMA-2 13B Chat (Light Blue):** Starts at approximately AUROC = 0.64 at 10<sup>2</sup> samples, increases to approximately AUROC = 0.74 at 10<sup>3</sup> samples, and stabilizes around AUROC = 0.76 at 10<sup>4</sup> samples.
* **Mistral 7B Instruct (Teal):** Starts at approximately AUROC = 0.66 at 10<sup>2</sup> samples, increases to approximately AUROC = 0.75 at 10<sup>3</sup> samples, and stabilizes around AUROC = 0.77 at 10<sup>4</sup> samples.
* **Zero-Shot Classifier (Red Dashed):** Horizontal line at approximately AUROC = 0.61.
* **Sampling (Red Dashed):** Horizontal line at approximately AUROC = 0.61.
### Key Observations
* All models show a decreasing ECE with increasing sample size, indicating improved calibration.
* All models show an increasing AUROC with increasing sample size, indicating improved performance.
* Mistral 7B Instruct generally exhibits slightly higher AUROC values than the LLaMA-2 models.
* The LLaMA-2 13B Chat model performs slightly better than the 7B Chat model in both ECE and AUROC.
* The Zero-Shot Classifier and Sampling baselines perform consistently worse than all the LLMs across both metrics.
### Interpretation
The data suggests that increasing the number of samples used for evaluation improves both the calibration (ECE) and performance (AUROC) of all three LLMs. This is expected, as more samples provide a more robust estimate of the model's true capabilities. The Mistral 7B Instruct model appears to be slightly better calibrated and more performant than the LLaMA-2 models, particularly at larger sample sizes. The consistent underperformance of the Zero-Shot Classifier and Sampling baselines highlights the benefits of using fine-tuned LLMs for this task. The convergence of the lines at 10<sup>4</sup> samples suggests that the models are approaching a point of diminishing returns in terms of calibration and performance gains with further increases in sample size. The difference between ECE and AUROC provides a nuanced view of model quality: a low ECE indicates that the model's predicted probabilities are well-aligned with its actual accuracy, while a high AUROC indicates that the model is generally good at distinguishing between positive and negative examples.