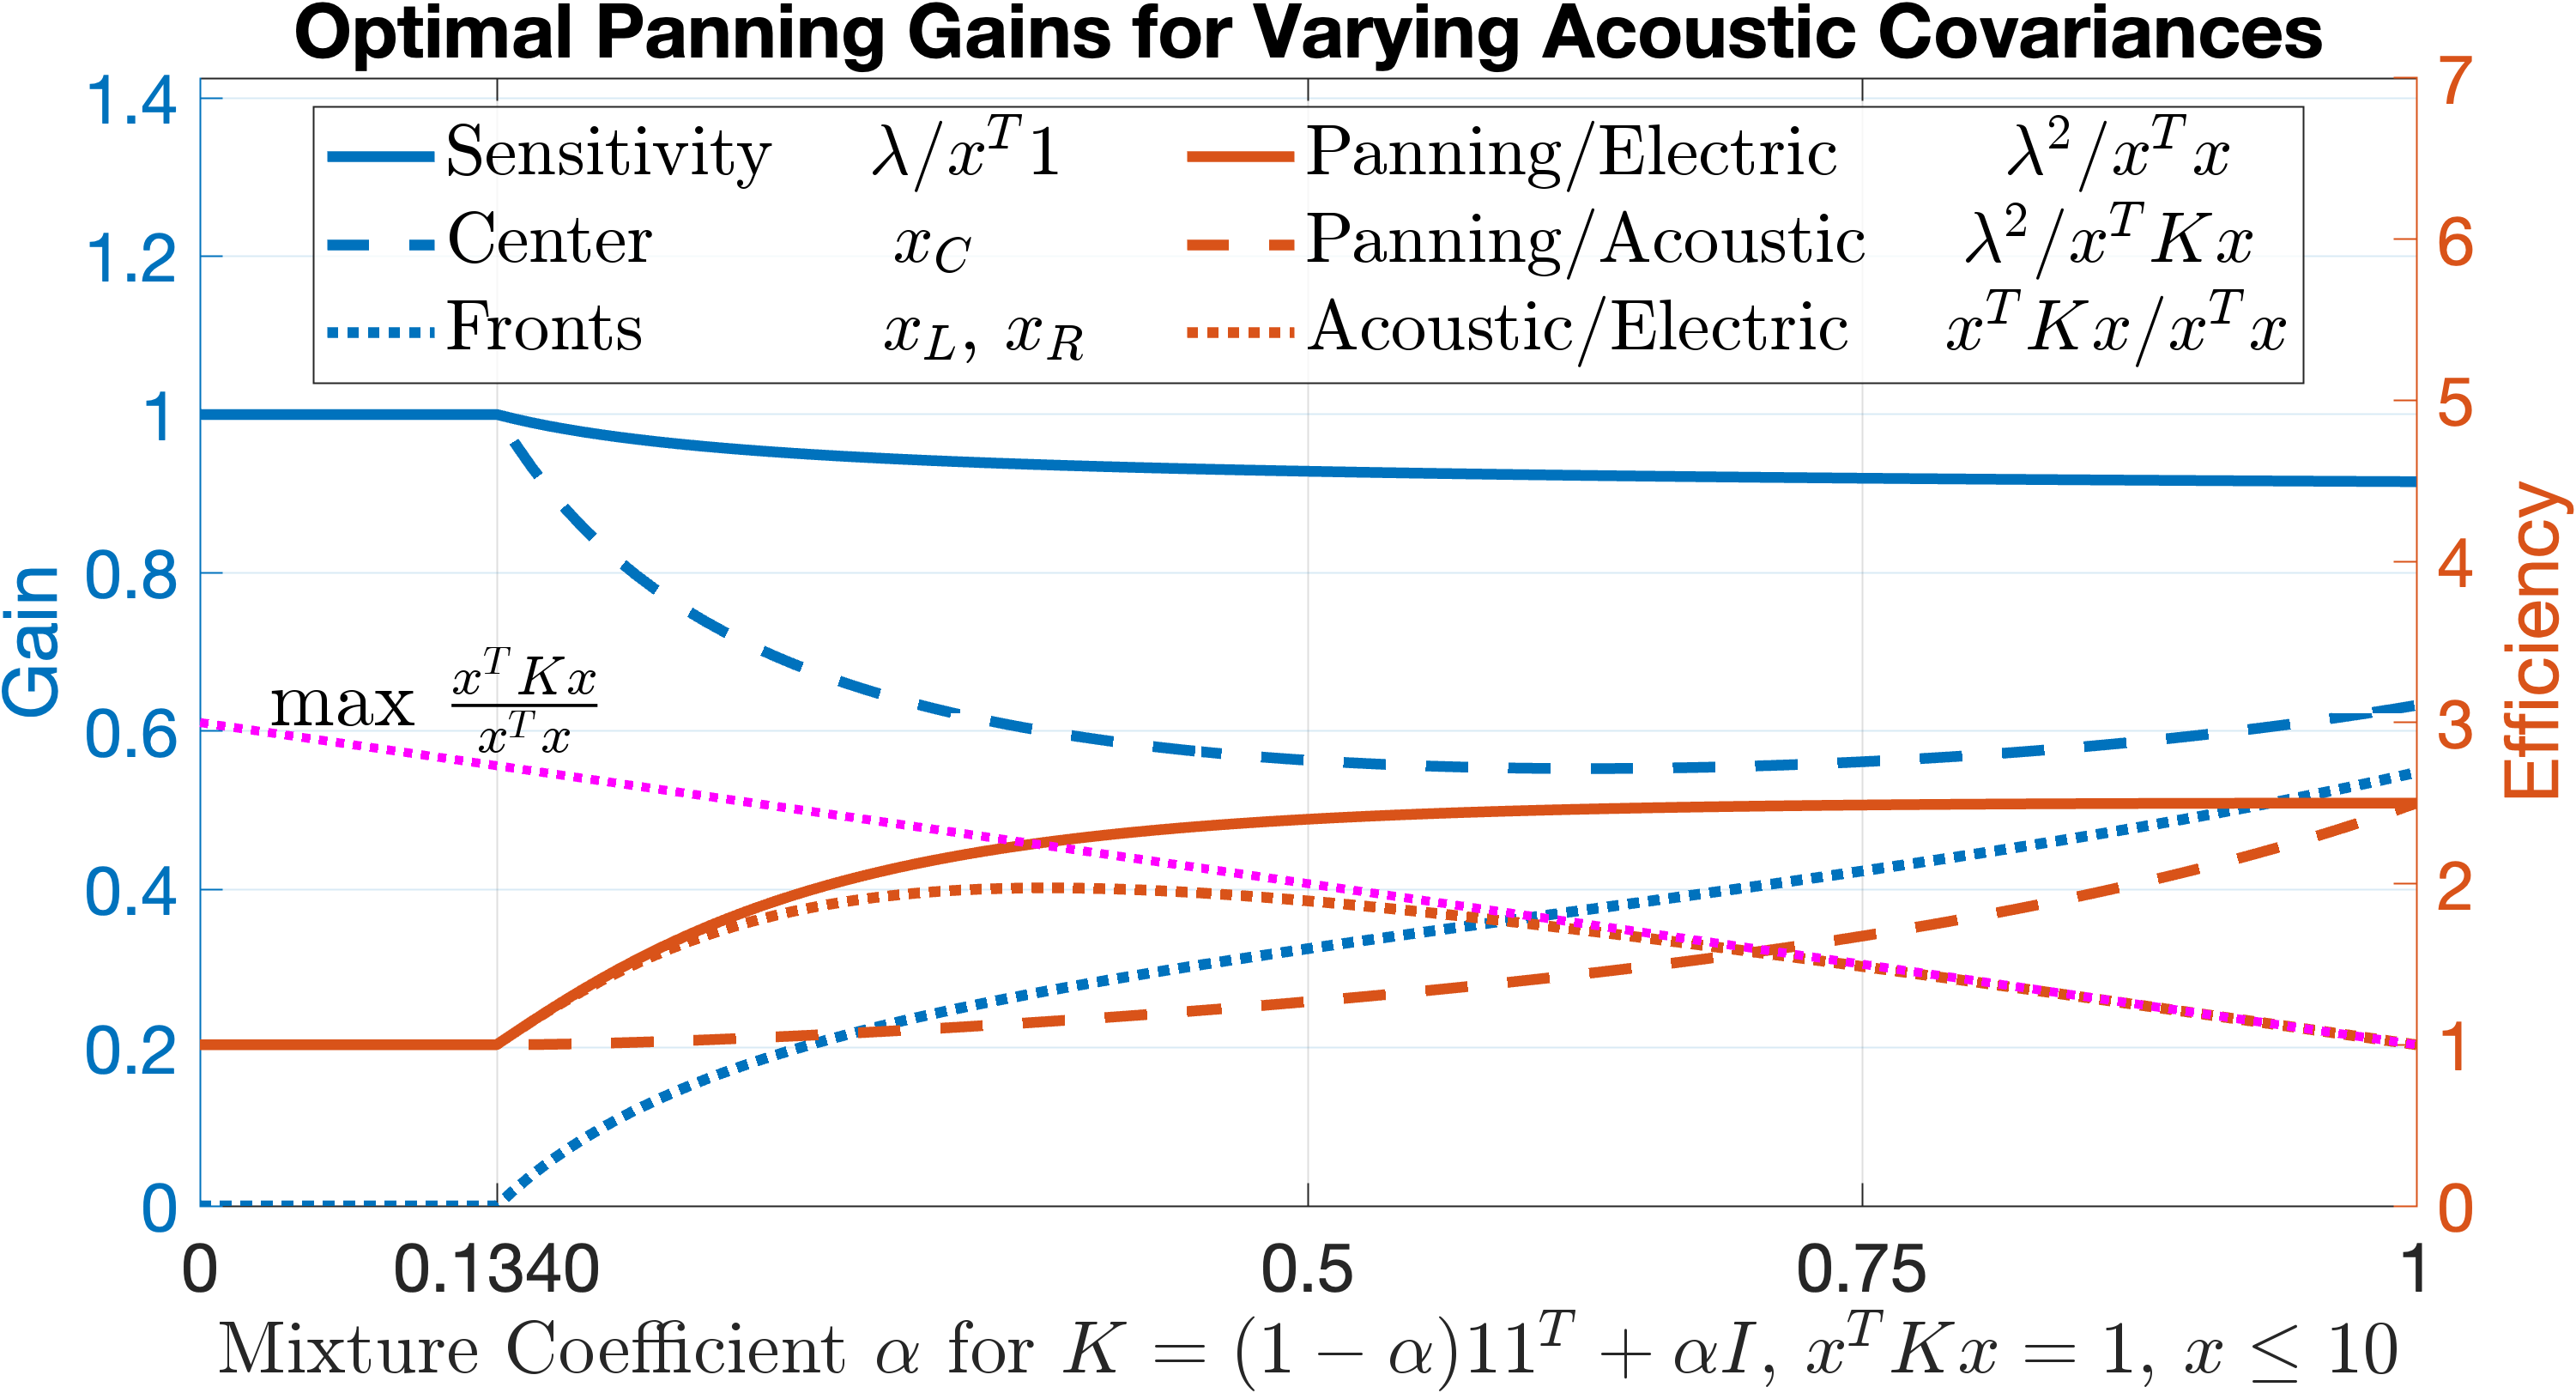
## Line Chart: Optimal Panning Gains for Varying Acoustic Covariances
### Overview
The chart visualizes the relationship between **Mixture Coefficient α** (x-axis) and two metrics: **Gain** (left y-axis) and **Efficiency** (right y-axis). It compares performance across three covariance types: Sensitivity, Center, Fronts (blue lines) and Panning/Electric, Panning/Acoustic, Acoustic/Electric (orange lines). Key trends include inverse relationships between Gain and Efficiency, with distinct behaviors for different covariance configurations.
---
### Components/Axes
- **X-axis**:
- Label: "Mixture Coefficient α for K = (1 - α)11ᵀ + αI, xᵀKx = 1, x ≤ 10"
- Range: 0 to 1 (linear scale)
- Notable: Formula defines the covariance structure, with α controlling the mix between rank-1 matrix (11ᵀ) and identity matrix (I).
- **Y-axes**:
- **Left (Gain)**:
- Label: "Gain"
- Range: 0 to 1.4 (linear scale)
- **Right (Efficiency)**:
- Label: "Efficiency"
- Range: 0 to 7 (linear scale)
- **Legends**:
- **Left (Gain)**:
- Solid blue: "Sensitivity" (λ/xᵀ1)
- Dashed blue: "Center" (x_C)
- Dotted blue: "Fronts" (x_L, x_R)
- **Right (Efficiency)**:
- Solid orange: "Panning/Electric" (λ²/xᵀx)
- Dashed orange: "Panning/Acoustic" (λ²/xᵀKx)
- Dotted orange: "Acoustic/Electric" (xᵀKx/xᵀx)
---
### Detailed Analysis
1. **Gain (Left Y-axis)**:
- **Sensitivity (solid blue)**: Starts at ~1.0, decreases slightly to ~0.95 as α increases.
- **Center (dashed blue)**: Begins at ~0.6, rises to ~1.0 by α=1.
- **Fronts (dotted blue)**: Starts at 0, increases to ~0.6 by α=1.
2. **Efficiency (Right Y-axis)**:
- **Panning/Electric (solid orange)**: Starts at ~0, rises to ~3 by α=1.
- **Panning/Acoustic (dashed orange)**: Starts at ~5, decreases to ~2 by α=1.
- **Acoustic/Electric (dotted orange)**: Starts at ~0, rises to ~4 by α=1.
3. **Key Intersections**:
- At α=0.134, Gain (Sensitivity) intersects Efficiency (Panning/Electric) at ~0.6.
- At α=0.75, Gain (Center) intersects Efficiency (Acoustic/Electric) at ~0.8.
---
### Key Observations
- **Inverse Relationship**: Higher Gain (blue lines) correlates with lower Efficiency (orange lines) for most α values.
- **Fronts Line Behavior**: The dotted blue "Fronts" line starts at 0 but surpasses other Gain lines by α=1, suggesting improved performance at higher α.
- **Panning/Acoustic Drop**: The dashed orange line (Panning/Acoustic) shows a sharp decline in Efficiency as α increases, indicating poor scalability.
- **Acoustic/Electric Rise**: The dotted orange line (Acoustic/Electric) demonstrates strong Efficiency growth, peaking at α=1.
---
### Interpretation
1. **Trade-off Dynamics**:
- The chart highlights a trade-off between Gain and Efficiency. For example, maximizing Gain (via Center or Fronts configurations) reduces Efficiency, particularly for Panning/Acoustic.
- The Fronts configuration (dotted blue) achieves moderate Gain while maintaining rising Efficiency, suggesting a balanced approach.
2. **Covariance Impact**:
- **Sensitivity (λ/xᵀ1)**: Prioritizes high Gain but suffers from low Efficiency at low α.
- **Panning/Electric (λ²/xᵀx)**: Efficiency scales linearly with α, but Gain remains flat.
- **Acoustic/Electric (xᵀKx/xᵀx)**: Combines rising Efficiency with moderate Gain, ideal for high-α scenarios.
3. **Practical Implications**:
- For applications requiring high Gain (e.g., signal detection), Sensitivity or Center configurations are preferable at low α.
- For efficiency-critical tasks (e.g., resource allocation), Acoustic/Electric or Panning/Electric configurations dominate at high α.
- The Fronts configuration emerges as a versatile middle ground, balancing both metrics.
4. **Anomalies**:
- The sharp drop in Panning/Acoustic Efficiency (dashed orange) at α=0.75 suggests a critical threshold where acoustic covariance becomes inefficient.
- The Gain/Efficiency intersection at α=0.134 marks a potential "break-even" point for Sensitivity and Panning/Electric.
---
### Conclusion
The chart demonstrates how varying α (and thus covariance structure) impacts performance metrics. Designers must balance Gain and Efficiency based on application needs, with Fronts and Acoustic/Electric configurations offering optimal compromises. The inverse relationship underscores the need for context-aware parameter tuning.