## Neural Network Visualization: Inputs and Outputs
### Overview
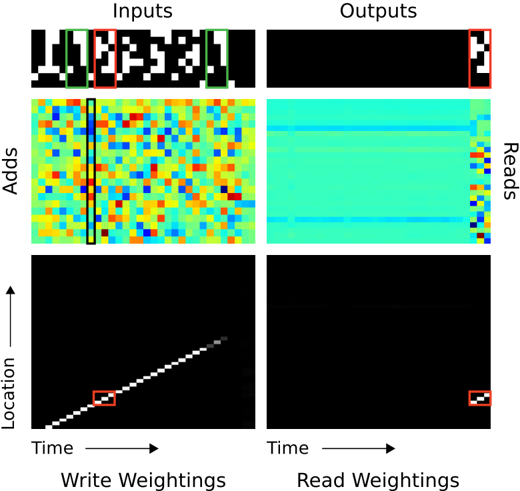
The image presents a visualization of the internal workings of a neural network, specifically focusing on the inputs, outputs, adds, reads, write weightings, and read weightings. The visualization is structured as a 3x2 grid, with "Inputs" on the left and "Outputs" on the right. Each row represents a different aspect of the network's operation: the first row shows the raw input and output data, the second row shows the "Adds" and "Reads" operations, and the third row shows the "Write Weightings" and "Read Weightings" over time and location.
### Components/Axes
* **Titles:**
* Top: "Inputs" (left), "Outputs" (right)
* Left Column: "Adds", "Location" (with an upward-pointing arrow)
* Bottom Row: "Time" (with a rightward-pointing arrow), "Write Weightings" (left), "Read Weightings" (right)
* Right Column: "Reads"
* **Axes:**
* The "Adds" and "Reads" visualizations appear to be heatmaps, with no explicit axes labels.
* The "Location" vs. "Time" plots have axes labeled "Location" (vertical) and "Time" (horizontal).
* **Annotations:**
* There are red, green, and black rectangular boxes highlighting specific regions in the visualizations.
### Detailed Analysis
**Row 1: Inputs and Outputs**
* **Inputs (Top-Left):** A binary image consisting of black and white pixels. The image appears to contain a pattern or character. A red box highlights a small section of the input, and a green box highlights a larger section.
* **Outputs (Top-Right):** A mostly black image with a small section of white pixels in the bottom-right corner. A red box highlights this section, and a green box highlights a larger section.
**Row 2: Adds and Reads**
* **Adds (Middle-Left):** A heatmap with a color gradient ranging from blue to red. The distribution of colors appears random, with no clear pattern. A black box highlights a vertical section of the heatmap.
* **Reads (Middle-Right):** A heatmap with a color gradient ranging from blue to red. The heatmap is predominantly cyan, with some vertical stripes of other colors on the right side.
**Row 3: Write Weightings and Read Weightings**
* **Write Weightings (Bottom-Left):** A black image with a diagonal line of white pixels extending from the bottom-left to the top-right. The line represents the weights being written over time and location. A red box highlights a small section of the diagonal line.
* **Read Weightings (Bottom-Right):** A mostly black image with a small cluster of white pixels in the bottom-right corner. A red box highlights this cluster.
### Key Observations
* The input image contains a distinct pattern, while the output image is mostly black with a small, localized activation.
* The "Adds" heatmap shows a seemingly random distribution of values, while the "Reads" heatmap shows a more structured pattern.
* The "Write Weightings" plot shows a clear diagonal pattern, indicating a sequential writing process.
* The "Read Weightings" plot shows a localized activation, suggesting that the network is reading from a specific location.
### Interpretation
The image provides a glimpse into the internal operations of a neural network, likely a memory-augmented neural network (MANN) or a similar architecture. The "Adds" and "Reads" heatmaps likely represent the memory content being written to and read from, respectively. The "Write Weightings" and "Read Weightings" plots show how the network is accessing its memory over time.
The fact that the output is mostly black suggests that the network is either still learning or that the input pattern is not strongly associated with any particular output. The localized activation in the "Read Weightings" plot suggests that the network is focusing on a specific memory location to produce the output.
The diagonal line in the "Write Weightings" plot indicates that the network is sequentially writing information to memory. This could be related to how the network is processing the input sequence or how it is storing information for later use.