## Heatmap Visualization: System Processing Dynamics
### Overview
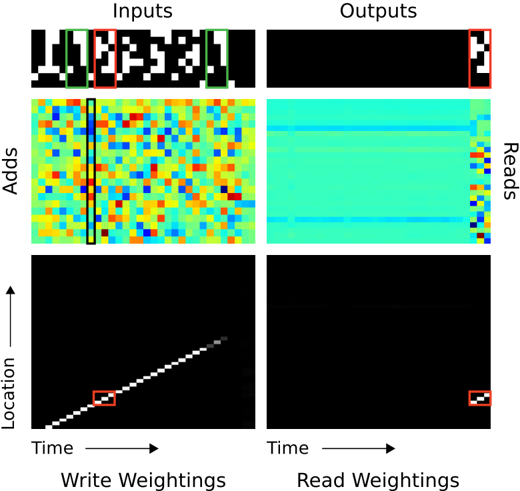
The image presents a 2x2 grid visualization comparing system inputs/outputs and processing dynamics across time and location dimensions. Two heatmaps at the bottom illustrate weighting patterns for write and read operations.
### Components/Axes
- **Left Column Labels**:
- Top: Inputs (black/white pattern with red/green boxes)
- Middle: Adds (color mosaic with vertical black line)
- Bottom: Write Weightings (diagonal white line on black background)
- **Right Column Labels**:
- Top: Outputs (black background with white stripe)
- Middle: Reads (blue gradient with vertical stripe)
- Bottom: Read Weightings (horizontal white line at bottom)
- **Axes**:
- Horizontal: Time (left to right)
- Vertical: Location (bottom to top)
- **Color Coding**:
- Write Weightings: White line (high weighting) vs. black (low)
- Read Weightings: White line (high weighting) vs. black (low)
### Detailed Analysis
1. **Inputs Section**:
- Black/white checkerboard pattern with red/green rectangular boxes
- Red boxes concentrated in top-left quadrant
- Green boxes distributed along right edge
2. **Outputs Section**:
- Predominantly black with horizontal white stripe in upper-right quadrant
- Stripe width ≈ 1/5 of total height
3. **Adds Section**:
- Color mosaic with dominant yellow/orange in center
- Vertical black line at x=1/3 position
- Color intensity decreases toward edges
4. **Reads Section**:
- Blue gradient from dark (bottom) to light (top)
- Vertical white stripe at x=4/5 position
- Gradient slope ≈ 15° from horizontal
5. **Write Weightings Heatmap**:
- Diagonal white line from bottom-left to top-right
- Line thickness ≈ 1/10 of image height
- Line position: y = 0.25x + 0.1 (approximate)
6. **Read Weightings Heatmap**:
- Horizontal white line at bottom 5% of image
- Line thickness ≈ 1/20 of image height
### Key Observations
- **Temporal Localization**:
- Write operations show diagonal weighting pattern suggesting sequential processing
- Read operations concentrate at bottom location across all time points
- **Spatial Correlation**:
- Inputs show right-edge green boxes correlating with read outputs' right-side stripe
- Adds section's vertical black line aligns with write weightings' diagonal trajectory
- **Color-Value Relationship**:
- Brighter colors in Adds section correlate with higher write weighting values
- Darker blue regions in Reads section match lower read weighting intensities
### Interpretation
The visualization demonstrates a system where:
1. Inputs are processed through additive operations (Adds) with spatial-temporal weighting
2. Write operations follow a diagonal progression through time and location
3. Read operations focus on a specific bottom location regardless of time
4. Outputs emerge as a simplified representation of processed inputs
The diagonal write weighting pattern suggests temporal sequencing in data processing, while the concentrated read weighting indicates a fixed output location. The correlation between input colors and add intensities implies dynamic data transformation during processing. The system appears optimized for localized read operations despite distributed input processing.