## Line Chart: Model Performance on Lichess Puzzle Accuracy
### Overview
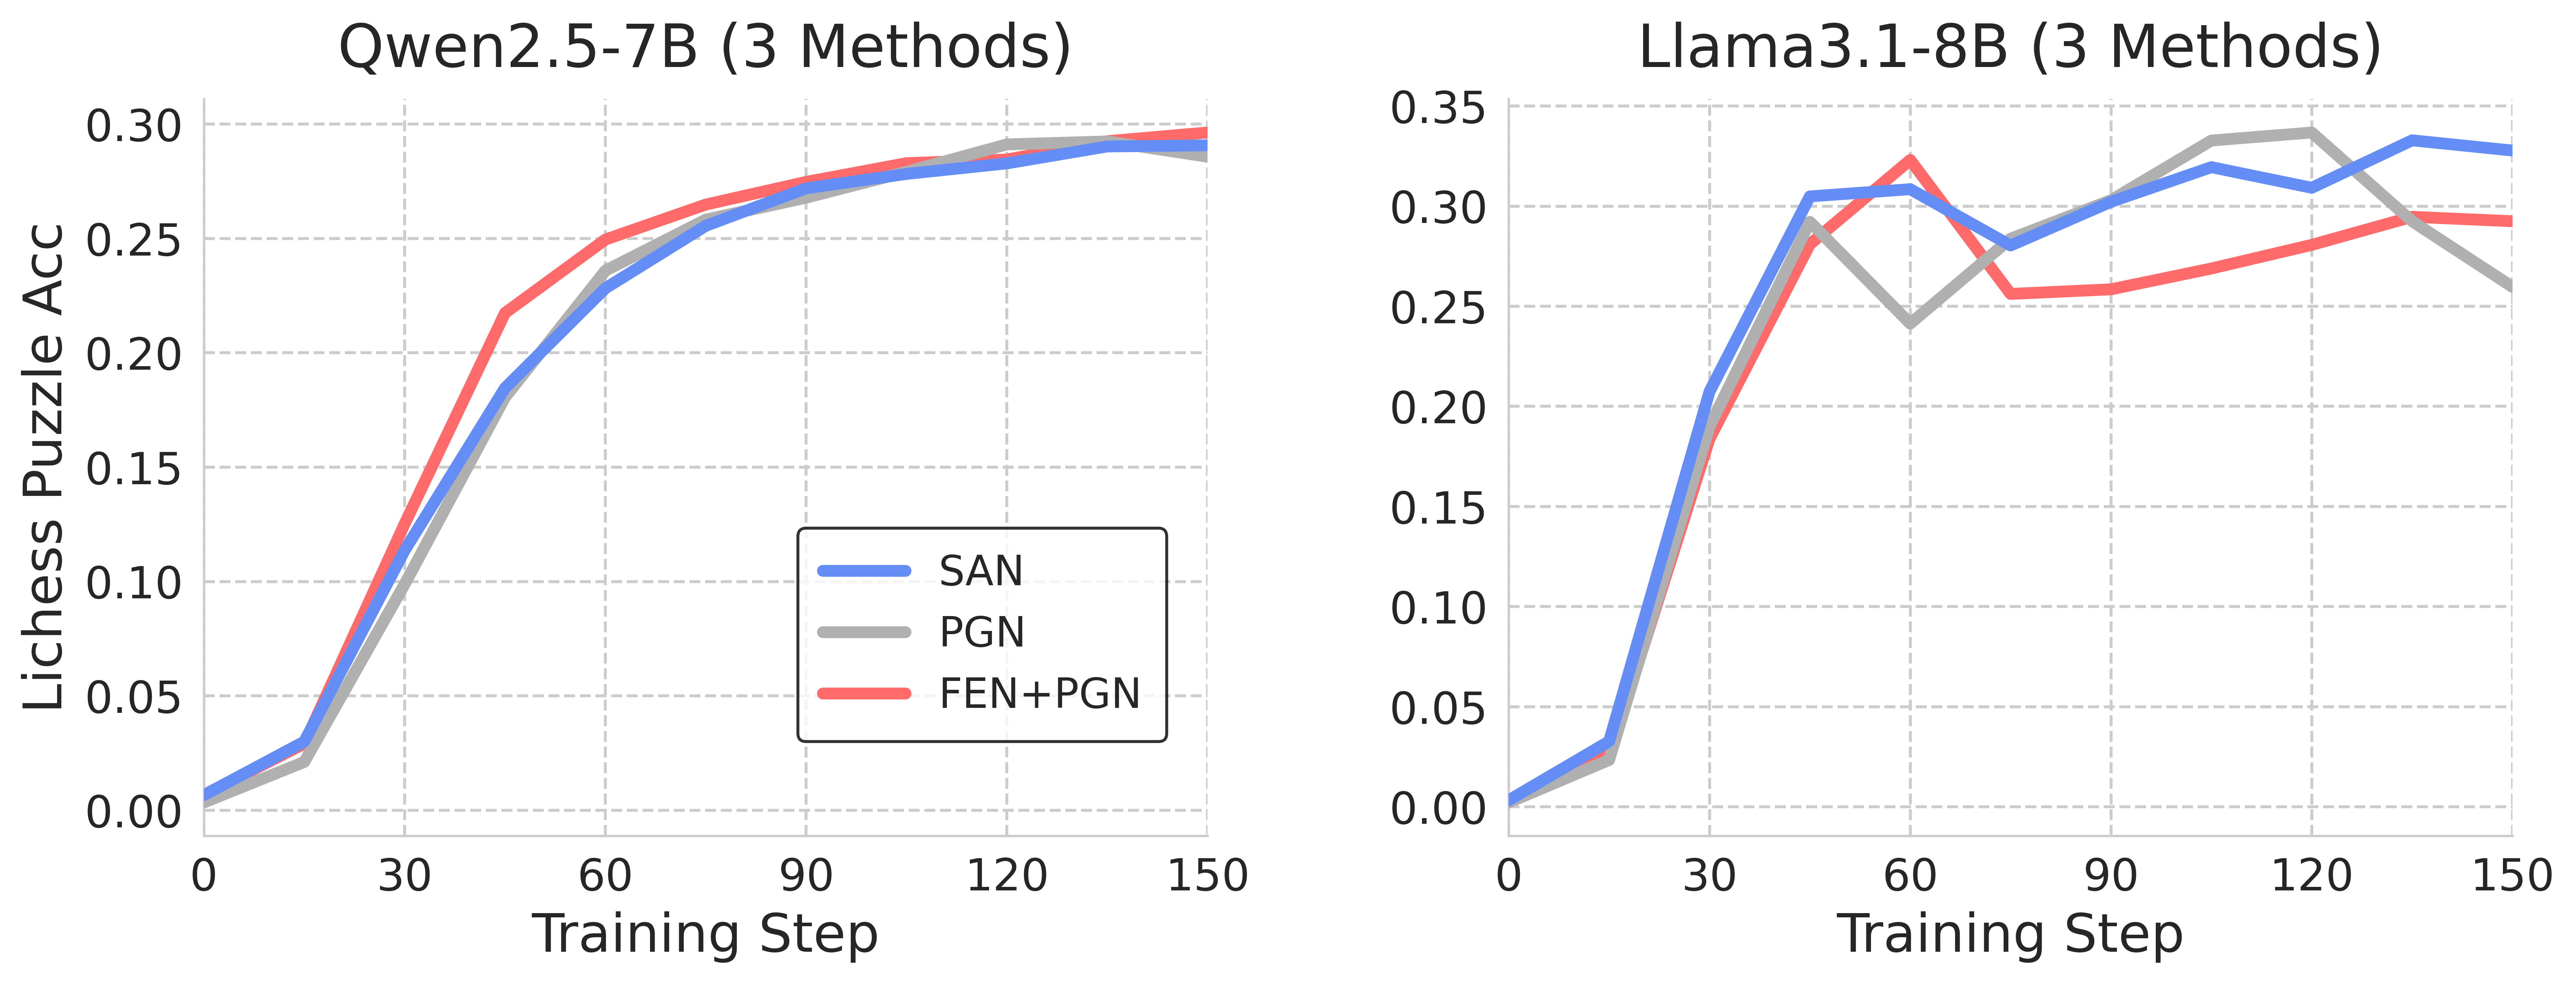
The image presents two line charts comparing the performance of two language models, Qwen2.5-7B and Llama3.1-8B, on solving Lichess puzzles. The performance is measured by "Lichess Puzzle Acc" (Accuracy) against "Training Step". Each chart displays three different training methods: SAN, PGN, and FEN+PGN.
### Components/Axes
* **X-axis:** "Training Step" ranging from 0 to 150.
* **Y-axis:** "Lichess Puzzle Acc" ranging from 0.00 to 0.35.
* **Left Chart Title:** "Qwen2.5-7B (3 Methods)"
* **Right Chart Title:** "Llama3.1-8B (3 Methods)"
* **Legend (Bottom-Right of both charts):**
* SAN (Blue)
* PGN (Gray)
* FEN+PGN (Red)
* **Gridlines:** Horizontal and vertical gridlines are present on both charts to aid in reading values.
### Detailed Analysis or Content Details
**Qwen2.5-7B Chart:**
* **SAN (Blue):** The line starts at approximately 0.00 at Training Step 0, rapidly increases to around 0.25 by Training Step 30, and plateaus around 0.28-0.30 from Training Step 60 onwards.
* **PGN (Gray):** The line starts at approximately 0.00 at Training Step 0, increases more slowly than SAN, reaching around 0.18 by Training Step 30, and continues to increase, reaching approximately 0.26 by Training Step 150.
* **FEN+PGN (Red):** The line starts at approximately 0.00 at Training Step 0, increases rapidly, surpassing both SAN and PGN by Training Step 30 (around 0.26), and plateaus around 0.29-0.30 from Training Step 90 onwards.
**Llama3.1-8B Chart:**
* **SAN (Blue):** The line starts at approximately 0.00 at Training Step 0, increases rapidly to around 0.28 by Training Step 30, then fluctuates between approximately 0.28 and 0.32 for the remainder of the training steps.
* **PGN (Gray):** The line starts at approximately 0.00 at Training Step 0, increases to around 0.22 by Training Step 30, then fluctuates between approximately 0.22 and 0.28 for the remainder of the training steps.
* **FEN+PGN (Red):** The line starts at approximately 0.00 at Training Step 0, increases rapidly to around 0.26 by Training Step 30, then fluctuates between approximately 0.24 and 0.29 for the remainder of the training steps.
### Key Observations
* **Qwen2.5-7B:** FEN+PGN consistently outperforms both SAN and PGN throughout the training process. SAN initially shows the fastest improvement but plateaus earlier.
* **Llama3.1-8B:** SAN consistently outperforms both PGN and FEN+PGN throughout the training process. All three methods show more fluctuation in accuracy compared to Qwen2.5-7B.
* **Overall:** The FEN+PGN method appears to be more effective for Qwen2.5-7B, while the SAN method appears to be more effective for Llama3.1-8B.
### Interpretation
The charts demonstrate the impact of different training methods on the performance of two language models in solving Lichess puzzles. The varying performance suggests that the optimal training method is model-dependent.
For Qwen2.5-7B, combining FEN and PGN data seems to provide the most beneficial training signal, leading to higher accuracy. This could be because the model architecture is better suited to leverage the information contained in both FEN and PGN formats. The rapid initial improvement of SAN, followed by a plateau, suggests that the model quickly learns from the SAN data but reaches a limit in its ability to generalize.
For Llama3.1-8B, the SAN method consistently achieves the highest accuracy. The fluctuations in accuracy for all methods in the Llama3.1-8B chart might indicate a more sensitive training process or a higher variance in the puzzle difficulty. The lower overall accuracy compared to Qwen2.5-7B suggests that Llama3.1-8B may require more extensive training or a different architecture to achieve comparable performance on this task.
The differences in performance between the models and training methods highlight the importance of tailoring training strategies to specific model architectures and tasks. Further investigation could explore why certain methods are more effective for specific models and how to mitigate the fluctuations observed in the Llama3.1-8B chart.