\n
## Line Chart: Model Accuracy vs Number of Operands (digits=2) for Different Recurrence Levels
### Overview
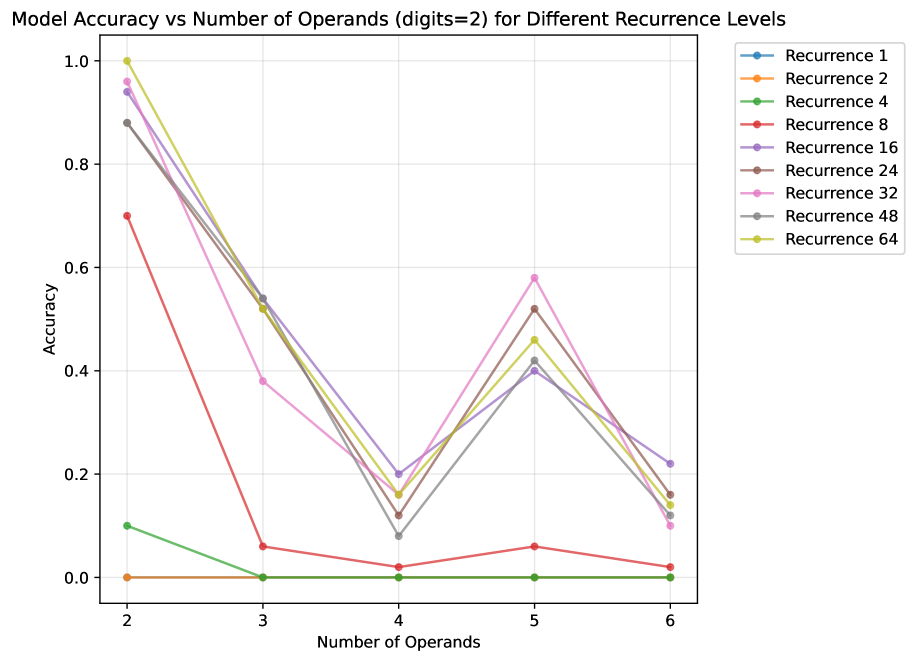
This is a line chart comparing the accuracy of a model across different numbers of operands (from 2 to 6) for nine distinct "Recurrence" levels. The chart demonstrates how model performance varies with problem complexity (number of operands) and a hyperparameter labeled "Recurrence." The overall trend shows a significant drop in accuracy as the number of operands increases from 2 to 4, followed by a partial recovery at 5 operands, and another decline at 6 operands for most recurrence levels.
### Components/Axes
* **Chart Title:** "Model Accuracy vs Number of Operands (digits=2) for Different Recurrence Levels"
* **X-Axis:**
* **Label:** "Number of Operands"
* **Scale:** Discrete integer values: 2, 3, 4, 5, 6.
* **Y-Axis:**
* **Label:** "Accuracy"
* **Scale:** Linear scale from 0.0 to 1.0, with major gridlines at intervals of 0.2.
* **Legend:** Positioned at the top-right of the chart area. It lists nine data series, each corresponding to a "Recurrence" level, identified by a unique color and marker (circle).
* Recurrence 1 (Blue)
* Recurrence 2 (Orange)
* Recurrence 4 (Green)
* Recurrence 8 (Red)
* Recurrence 16 (Purple)
* Recurrence 24 (Brown)
* Recurrence 32 (Pink)
* Recurrence 48 (Gray)
* Recurrence 64 (Yellow-Green/Olive)
### Detailed Analysis
The following describes each data series' visual trend and approximate data points, verified by color against the legend.
1. **Recurrence 1 (Blue):**
* **Trend:** Starts very high, drops sharply, then fluctuates at low accuracy.
* **Data Points:** (2, ~0.94), (3, ~0.54), (4, ~0.20), (5, ~0.40), (6, ~0.22).
2. **Recurrence 2 (Orange):**
* **Trend:** Flatline at near-zero accuracy across all operand counts.
* **Data Points:** (2, ~0.00), (3, ~0.00), (4, ~0.00), (5, ~0.00), (6, ~0.00).
3. **Recurrence 4 (Green):**
* **Trend:** Starts low, drops to zero, and remains flat.
* **Data Points:** (2, ~0.10), (3, ~0.00), (4, ~0.00), (5, ~0.00), (6, ~0.00).
4. **Recurrence 8 (Red):**
* **Trend:** Starts moderately high, drops sharply, and remains very low.
* **Data Points:** (2, ~0.70), (3, ~0.06), (4, ~0.02), (5, ~0.06), (6, ~0.02).
5. **Recurrence 16 (Purple):**
* **Trend:** Starts very high, drops, recovers partially, then declines.
* **Data Points:** (2, ~0.94), (3, ~0.54), (4, ~0.20), (5, ~0.40), (6, ~0.22).
6. **Recurrence 24 (Brown):**
* **Trend:** Starts very high, drops, recovers significantly, then declines.
* **Data Points:** (2, ~0.88), (3, ~0.52), (4, ~0.12), (5, ~0.52), (6, ~0.16).
7. **Recurrence 32 (Pink):**
* **Trend:** Starts very high, drops, recovers to the highest peak at 5 operands, then declines sharply.
* **Data Points:** (2, ~0.96), (3, ~0.38), (4, ~0.16), (5, ~0.58), (6, ~0.10).
8. **Recurrence 48 (Gray):**
* **Trend:** Starts very high, drops, recovers, then declines.
* **Data Points:** (2, ~0.88), (3, ~0.52), (4, ~0.08), (5, ~0.42), (6, ~0.12).
9. **Recurrence 64 (Yellow-Green/Olive):**
* **Trend:** Starts at the maximum (1.0), drops, recovers, then declines.
* **Data Points:** (2, 1.00), (3, ~0.52), (4, ~0.16), (5, ~0.46), (6, ~0.14).
### Key Observations
* **Universal Difficulty Spike at 4 Operands:** All models, regardless of recurrence level, experience their lowest or near-lowest accuracy at 4 operands, indicating a specific complexity threshold that is challenging for this model architecture.
* **Partial Recovery at 5 Operands:** Most models show a notable rebound in accuracy when moving from 4 to 5 operands, suggesting the difficulty is not strictly monotonic with operand count.
* **Recurrence Level Impact:** Higher recurrence levels (16, 24, 32, 48, 64) generally achieve higher peak accuracies (especially at 2 and 5 operands) compared to lower levels (1, 2, 4, 8). Recurrence 2 and 4 perform very poorly overall.
* **Outlier - Recurrence 32:** This series achieves the highest accuracy at 5 operands (~0.58) among all series at that point, despite not having the highest starting accuracy.
* **Convergence at Low Accuracy:** For 3 and 4 operands, the performance of many higher-recurrence models converges into a narrow band (approx. 0.08 to 0.54), showing less differentiation at these points.
### Interpretation
The data suggests that the model's ability to solve arithmetic problems (with 2-digit numbers) is highly sensitive to both the number of operands and the configured recurrence depth. The "Recurrence" hyperparameter likely controls the number of iterative processing steps the model can perform.
* **Insufficient Recurrence (Levels 1, 2, 4, 8):** These models lack the computational depth to handle the task, resulting in poor or zero accuracy, especially as complexity grows. Recurrence 2 and 4 appear to be fundamentally inadequate for this task.
* **Sufficient Recurrence (Levels 16+):** These models demonstrate a capacity for the task, but their performance is non-linear. The sharp drop at 4 operands could indicate a point where the problem structure becomes qualitatively harder, perhaps requiring a type of reasoning or memory access that the model struggles with at that specific complexity. The recovery at 5 operands is intriguing and might suggest that problems with 5 operands have a different, more manageable structure for the model than those with 4.
* **Practical Implication:** There is a clear trade-off. Increasing recurrence improves potential accuracy but likely comes with higher computational cost. The optimal recurrence level depends on the expected operand count in deployment. For problems consistently around 2 or 5 operands, higher recurrence (e.g., 32, 64) is beneficial. For problems with 3 or 4 operands, even high recurrence yields modest gains, suggesting a fundamental model limitation at those complexities. The chart provides a guide for hyperparameter tuning based on the target problem distribution.