## Chart Type: Line Graphs Comparing Llama-3-8B and Llama-3-70B
### Overview
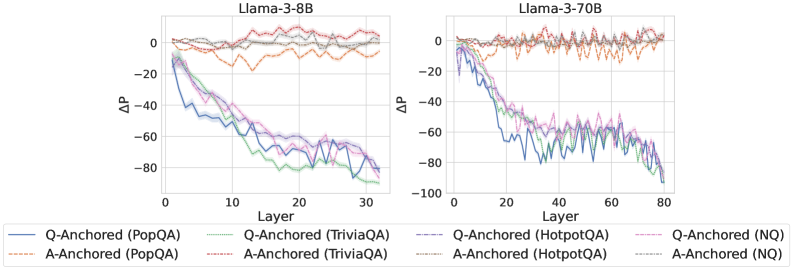
The image presents two line graphs side-by-side, comparing the performance of Llama-3-8B (left) and Llama-3-70B (right) models across different layers. The y-axis represents ΔP (Delta P), and the x-axis represents the Layer number. Each graph displays six data series, representing "Q-Anchored" and "A-Anchored" performance on four different question-answering datasets: PopQA, TriviaQA, HotpotQA, and NQ.
### Components/Axes
* **Titles:**
* Left Graph: "Llama-3-8B"
* Right Graph: "Llama-3-70B"
* **X-Axis:**
* Label: "Layer"
* Left Graph: Scale from 0 to 30, with tick marks at approximately 0, 10, 20, and 30.
* Right Graph: Scale from 0 to 80, with tick marks at approximately 0, 20, 40, 60, and 80.
* **Y-Axis:**
* Label: "ΔP"
* Scale: From -80 to 0 on the left graph, and from -100 to 0 on the right graph, with tick marks at -80, -60, -40, -20, and 0 on the left, and -100, -80, -60, -40, -20, and 0 on the right.
* **Legend:** Located at the bottom of the image.
* **Q-Anchored (PopQA):** Solid Blue Line
* **A-Anchored (PopQA):** Dashed Brown Line
* **Q-Anchored (TriviaQA):** Dotted Green Line
* **A-Anchored (TriviaQA):** Dashed-Dotted Gray Line
* **Q-Anchored (HotpotQA):** Dashed-Dotted Pink Line
* **A-Anchored (HotpotQA):** Dotted Orange Line
* **Q-Anchored (NQ):** Dashed Pink Line
* **A-Anchored (NQ):** Dotted Gray Line
### Detailed Analysis
**Llama-3-8B (Left Graph):**
* **Q-Anchored (PopQA):** (Solid Blue Line) Starts at approximately 0 and decreases to approximately -70 by layer 30.
* **A-Anchored (PopQA):** (Dashed Brown Line) Remains relatively flat around 0.
* **Q-Anchored (TriviaQA):** (Dotted Green Line) Starts at approximately 0 and decreases to approximately -70 by layer 30.
* **A-Anchored (TriviaQA):** (Dashed-Dotted Gray Line) Remains relatively flat around 0.
* **Q-Anchored (HotpotQA):** (Dashed-Dotted Pink Line) Starts at approximately 0 and decreases to approximately -50 by layer 30.
* **A-Anchored (HotpotQA):** (Dotted Orange Line) Remains relatively flat around -10.
* **Q-Anchored (NQ):** (Dashed Pink Line) Starts at approximately 0 and decreases to approximately -60 by layer 30.
* **A-Anchored (NQ):** (Dotted Gray Line) Remains relatively flat around 0.
**Llama-3-70B (Right Graph):**
* **Q-Anchored (PopQA):** (Solid Blue Line) Starts at approximately 0 and decreases to approximately -60 by layer 20, then fluctuates between -60 and -80 until layer 80.
* **A-Anchored (PopQA):** (Dashed Brown Line) Remains relatively flat around 0, with some fluctuations.
* **Q-Anchored (TriviaQA):** (Dotted Green Line) Starts at approximately 0 and decreases to approximately -60 by layer 20, then fluctuates between -60 and -80 until layer 80.
* **A-Anchored (TriviaQA):** (Dashed-Dotted Gray Line) Remains relatively flat around 0.
* **Q-Anchored (HotpotQA):** (Dashed-Dotted Pink Line) Starts at approximately 0 and decreases to approximately -50 by layer 20, then fluctuates between -50 and -70 until layer 80.
* **A-Anchored (HotpotQA):** (Dotted Orange Line) Remains relatively flat around -5, with some fluctuations.
* **Q-Anchored (NQ):** (Dashed Pink Line) Starts at approximately 0 and decreases to approximately -50 by layer 20, then fluctuates between -50 and -70 until layer 80.
* **A-Anchored (NQ):** (Dotted Gray Line) Remains relatively flat around 0.
### Key Observations
* For both models, the "Q-Anchored" data series (PopQA, TriviaQA, HotpotQA, and NQ) show a decreasing trend as the layer number increases, indicating a change in performance across layers.
* The "A-Anchored" data series (PopQA, TriviaQA, HotpotQA, and NQ) remain relatively flat, suggesting a different behavior compared to the "Q-Anchored" series.
* The Llama-3-70B model shows more fluctuation in the "Q-Anchored" data series after layer 20 compared to the Llama-3-8B model.
* The Llama-3-70B model has a larger number of layers (80) compared to the Llama-3-8B model (30).
### Interpretation
The graphs suggest that the "Q-Anchored" performance changes significantly across the layers of both Llama-3-8B and Llama-3-70B models, while the "A-Anchored" performance remains relatively stable. The fluctuations observed in the Llama-3-70B model after layer 20 could indicate a more complex interaction between layers in the larger model. The difference in the number of layers between the two models may contribute to the observed performance differences. The data implies that the way the question is anchored within the model's architecture has a significant impact on how performance evolves through the layers, while anchoring the answer has a less pronounced effect. The specific datasets (PopQA, TriviaQA, HotpotQA, NQ) seem to influence the magnitude of the performance change, but the overall trend remains consistent.