## Scatter Plot: Accuracy vs. Time-to-Answer for Different k Values
### Overview
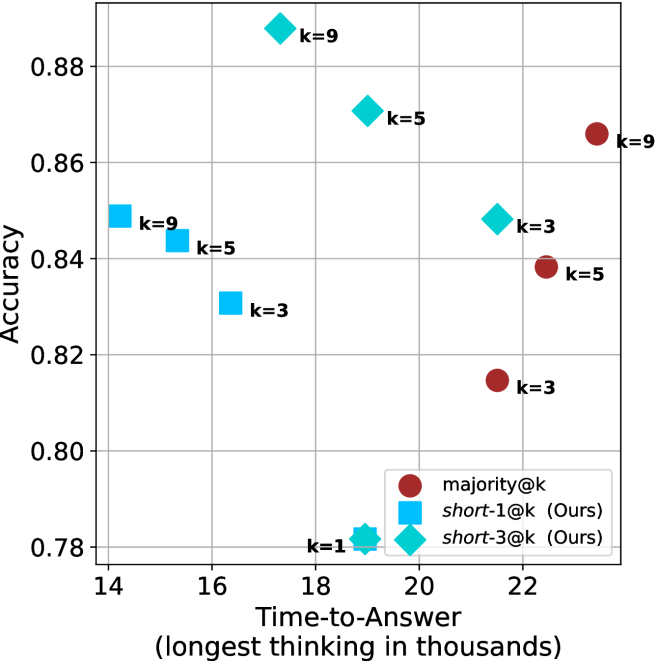
The chart compares the accuracy and time-to-answer performance of three algorithms (`majority@k`, `short-1@k`, `short-3@k`) across different `k` values (3, 5, 9). Accuracy is plotted on the y-axis (0.78–0.88), and time-to-answer (in thousands of units) is on the x-axis (14–22). Data points are color-coded and symbol-coded per algorithm.
---
### Components/Axes
- **Y-Axis (Accuracy)**: Labeled "Accuracy" with ticks at 0.78, 0.80, 0.82, 0.84, 0.86, 0.88.
- **X-Axis (Time-to-Answer)**: Labeled "Time-to-Answer (longest thinking in thousands)" with ticks at 14, 16, 18, 20, 22.
- **Legend**: Located at the bottom-right corner, mapping:
- Red circles: `majority@k`
- Blue squares: `short-1@k` (Ours)
- Cyan diamonds: `short-3@k` (Ours)
- **Data Points**: Positioned across the grid with approximate coordinates (x, y) and labeled with `k` values.
---
### Detailed Analysis
#### Data Points by Algorithm
1. **`majority@k` (Red Circles)**:
- (16, 0.84)
- (18, 0.86)
- (20, 0.84)
- (22, 0.86)
- (22, 0.82)
- (22, 0.86) [k=9]
2. **`short-1@k` (Blue Squares)**:
- (15, 0.83)
- (16, 0.84)
- (18, 0.85)
- (19, 0.82)
3. **`short-3@k` (Cyan Diamonds)**:
- (17, 0.87)
- (19, 0.86)
- (21, 0.85)
- (19, 0.84) [k=3]
---
### Key Observations
1. **Accuracy vs. Time Trade-off**:
- `majority@k` achieves higher accuracy (0.84–0.86) but requires longer time (16–22k).
- `short-1@k` sacrifices accuracy (0.82–0.85) for faster response (15–19k).
- `short-3@k` balances both, with accuracy (0.84–0.87) and moderate time (17–21k).
2. **Outliers**:
- `short-3@k` at (19, 0.84) underperforms compared to other `short-3@k` points.
- `majority@k` at (22, 0.82) shows a drop in accuracy despite high time investment.
3. **Trends**:
- `majority@k` accuracy increases slightly with higher `k` (e.g., k=9 at 0.86).
- `short-1@k` accuracy decreases as `k` increases (e.g., k=3 at 0.84 vs. k=5 at 0.83).
---
### Interpretation
The chart demonstrates a clear trade-off between accuracy and computational efficiency. `majority@k` prioritizes accuracy at the cost of time, making it suitable for scenarios where precision is critical. Conversely, `short-1@k` optimizes for speed but with reduced accuracy, ideal for time-sensitive applications. `short-3@k` emerges as a middle-ground solution, offering competitive accuracy with moderate time requirements. Notably, higher `k` values in `majority@k` (e.g., k=9) yield marginally better accuracy but require significantly more time, suggesting diminishing returns. The anomaly in `short-3@k` at (19, 0.84) warrants further investigation into potential configuration or data inconsistencies.