## Scatter Plot: Accuracy vs. Time-to-Answer
### Overview
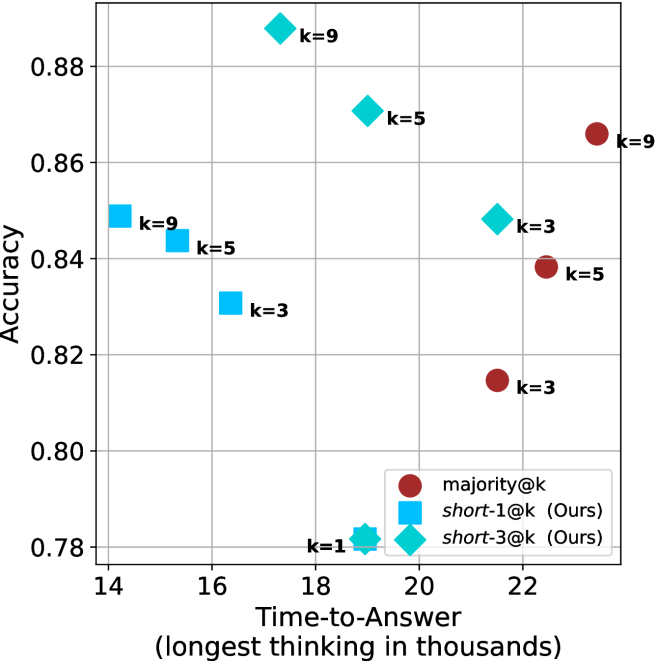
The image is a scatter plot comparing the accuracy of different methods (majority@k, short-1@k, and short-3@k) against their time-to-answer. The x-axis represents the time-to-answer in thousands, and the y-axis represents the accuracy. Each data point is labeled with a 'k' value, indicating a parameter used in the method.
### Components/Axes
* **X-axis:** Time-to-Answer (longest thinking in thousands). Scale ranges from 14 to 22, with gridlines at each integer value.
* **Y-axis:** Accuracy. Scale ranges from 0.78 to 0.88, with gridlines at intervals of 0.02.
* **Legend:** Located in the bottom-right corner.
* Red circle: majority@k
* Blue square: short-1@k (Ours)
* Teal diamond: short-3@k (Ours)
* **Data Points:** Each point is labeled with its corresponding 'k' value.
### Detailed Analysis
**1. majority@k (Red Circles):**
* Trend: As 'k' increases, both time-to-answer and accuracy increase.
* k=3: Time-to-Answer ≈ 21.5, Accuracy ≈ 0.815
* k=5: Time-to-Answer ≈ 22, Accuracy ≈ 0.84
* k=9: Time-to-Answer ≈ 22.5, Accuracy ≈ 0.865
**2. short-1@k (Blue Squares):**
* Trend: As 'k' increases, both time-to-answer and accuracy increase.
* k=1: Time-to-Answer ≈ 19.5, Accuracy ≈ 0.78
* k=3: Time-to-Answer ≈ 16, Accuracy ≈ 0.83
* k=5: Time-to-Answer ≈ 15.5, Accuracy ≈ 0.845
* k=9: Time-to-Answer ≈ 14.5, Accuracy ≈ 0.85
**3. short-3@k (Teal Diamonds):**
* Trend: As 'k' increases, both time-to-answer and accuracy increase.
* k=1: Time-to-Answer ≈ 19.5, Accuracy ≈ 0.78
* k=3: Time-to-Answer ≈ 21, Accuracy ≈ 0.85
* k=5: Time-to-Answer ≈ 18, Accuracy ≈ 0.87
* k=9: Time-to-Answer ≈ 17.5, Accuracy ≈ 0.89
### Key Observations
* For all three methods, increasing the value of 'k' generally leads to higher accuracy but also longer time-to-answer.
* The short-3@k method appears to achieve the highest accuracy overall, but also has a relatively high time-to-answer.
* The short-1@k method has the lowest time-to-answer, but also the lowest accuracy.
* The majority@k method has the highest time-to-answer, but does not achieve the highest accuracy.
### Interpretation
The scatter plot illustrates the trade-off between accuracy and time-to-answer for different methods and 'k' values. The choice of method and 'k' value would depend on the specific application and the relative importance of accuracy versus speed. The 'short-3@k' method seems to offer a good balance between accuracy and time-to-answer, especially for higher values of 'k'. The data suggests that increasing 'k' improves accuracy, but at the cost of increased processing time. The plot allows for a visual comparison of the performance characteristics of each method, aiding in the selection of the most suitable approach for a given task.