## Scatter Plot: Accuracy vs. Time-to-Answer for Different Inference Methods
### Overview
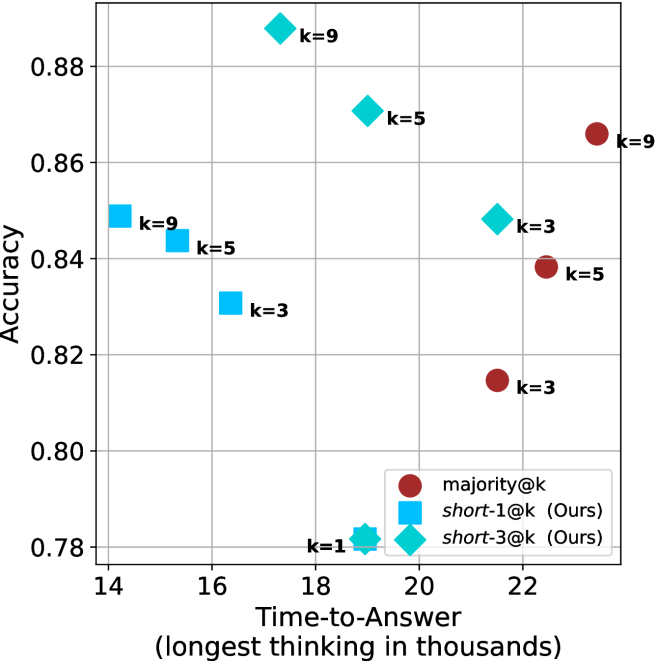
This image is a scatter plot comparing the performance of three different inference methods (`majority@k`, `short-1@k`, and `short-3@k`) across varying values of 'k'. The plot maps the "Time-to-Answer" (x-axis) against "Accuracy" (y-axis). The data suggests a trade-off between computational time and model accuracy, with the "Ours" methods generally showing distinct performance characteristics compared to the `majority@k` baseline.
### Components/Axes
* **X-Axis:** "Time-to-Answer (longest thinking in thousands)". The scale ranges from 14 to 22, with major grid lines at intervals of 2.
* **Y-Axis:** "Accuracy". The scale ranges from 0.78 to 0.88, with major grid lines at intervals of 0.02.
* **Legend (Bottom-Right):**
* **Dark Red Circle:** `majority@k`
* **Blue Square:** `short-1@k (Ours)`
* **Cyan Diamond:** `short-3@k (Ours)`
### Detailed Analysis
The data points are distributed across the plot. Below are the approximate coordinates (x, y) for each data series, derived from visual estimation against the grid lines.
**1. Blue Squares (`short-1@k (Ours)`)**
* **Trend:** As 'k' increases from 1 to 9, the time-to-answer decreases (moving left), while accuracy generally increases.
* **k=9:** (x ≈ 14.2, y ≈ 0.849)
* **k=5:** (x ≈ 15.3, y ≈ 0.844)
* **k=3:** (x ≈ 16.4, y ≈ 0.831)
* **k=1:** (x ≈ 19.0, y ≈ 0.782)
**2. Cyan Diamonds (`short-3@k (Ours)`)**
* **Trend:** As 'k' increases from 1 to 9, the time-to-answer increases (moving right), and accuracy increases significantly.
* **k=9:** (x ≈ 17.2, y ≈ 0.888)
* **k=5:** (x ≈ 18.8, y ≈ 0.871)
* **k=3:** (x ≈ 21.5, y ≈ 0.848)
* **k=1:** (x ≈ 19.0, y ≈ 0.782) — *Note: This point overlaps perfectly with the blue square k=1.*
**3. Dark Red Circles (`majority@k`)**
* **Trend:** As 'k' increases from 3 to 9, the time-to-answer increases (moving right), and accuracy increases.
* **k=9:** (x ≈ 23.4, y ≈ 0.866)
* **k=5:** (x ≈ 22.4, y ≈ 0.838)
* **k=3:** (x ≈ 21.5, y ≈ 0.815)
### Key Observations
* **Efficiency Leader:** The `short-1@k` method is the most efficient (fastest time-to-answer) for higher 'k' values (k=5, k=9), occupying the leftmost region of the chart.
* **Accuracy Leader:** The `short-3@k` method achieves the highest overall accuracy (k=9 at ~0.888), though it requires more time than `short-1@k`.
* **Convergence:** At k=1, both `short-1@k` and `short-3@k` converge to the exact same performance metrics (x ≈ 19.0, y ≈ 0.782).
* **Baseline Performance:** The `majority@k` method is consistently the slowest (highest time-to-answer) across all 'k' values compared to the "Ours" methods.
* **Anomalous Trend:** For `short-1@k`, increasing 'k' actually *decreases* the time-to-answer, which is counter-intuitive compared to the other methods where increasing 'k' increases time.
### Interpretation
The data demonstrates that the "Ours" methods (`short-1@k` and `short-3@k`) are generally superior to the `majority@k` baseline, as they achieve higher accuracy with lower time-to-answer.
Specifically, `short-3@k` appears to be the optimal choice for high-accuracy requirements, while `short-1@k` is the optimal choice for low-latency requirements. The fact that `short-1@k` becomes faster as 'k' increases suggests an architectural efficiency in how it handles larger 'k' values, perhaps by pruning or early-stopping mechanisms that become more effective as the sample size increases. The convergence at k=1 indicates that the distinction between the "short" methods is negligible at the lowest sample size.