\n
## Scatter Plot: Confidence vs. Target Length (High School Macroeconomics)
### Overview
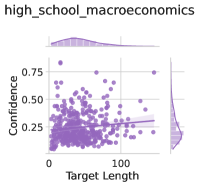
The image presents a scatter plot visualizing the relationship between "Target Length" and "Confidence" for data labeled as "high_school_macroeconomics". A regression line with a confidence interval is overlaid on the scatter points. Marginal distributions are shown above and to the right of the main plot.
### Components/Axes
* **X-axis:** "Target Length" - Scale ranges from approximately 0 to 150.
* **Y-axis:** "Confidence" - Scale ranges from approximately 0 to 0.75.
* **Scatter Points:** Purple dots representing individual data points.
* **Regression Line:** A dark purple line representing the trend of the data.
* **Confidence Interval:** A lighter purple shaded area around the regression line, indicating the uncertainty in the estimated trend.
* **Marginal Distribution (Top):** A density plot showing the distribution of "Target Length".
* **Marginal Distribution (Right):** A density plot showing the distribution of "Confidence".
* **Title:** "high\_school\_macroeconomics" - Located in the top-left corner.
### Detailed Analysis
The scatter plot shows a weak positive correlation between "Target Length" and "Confidence". The points are clustered, but there is significant scatter.
* **Regression Line Trend:** The regression line slopes slightly upward, indicating a positive, but weak, relationship.
* **Data Point Distribution:** Most data points fall within the "Confidence" range of 0.2 to 0.5.
* **Target Length Distribution:** The distribution of "Target Length" is skewed to the right, with a peak around 20-40.
* **Confidence Distribution:** The distribution of "Confidence" is concentrated towards lower values, with a tail extending towards higher values.
* **Approximate Data Points (sampled):**
* Target Length = 0, Confidence ≈ 0.25
* Target Length = 25, Confidence ≈ 0.35
* Target Length = 50, Confidence ≈ 0.40
* Target Length = 75, Confidence ≈ 0.30
* Target Length = 100, Confidence ≈ 0.25
* Target Length = 125, Confidence ≈ 0.20
* Outlier: Target Length ≈ 130, Confidence ≈ 0.70
### Key Observations
* The relationship between "Target Length" and "Confidence" is weak.
* There is a noticeable outlier at a "Target Length" of approximately 130 with a "Confidence" of approximately 0.70.
* The marginal distributions reveal that "Target Length" is more variable than "Confidence".
### Interpretation
The data suggests that, for this "high_school_macroeconomics" dataset, there is a very slight tendency for higher "Target Length" to be associated with higher "Confidence", but this relationship is not strong. The weak correlation implies that "Target Length" is not a reliable predictor of "Confidence". The outlier suggests that there may be specific cases where longer targets lead to significantly higher confidence, but these are rare. The distributions indicate that the "Target Length" varies more widely than the "Confidence" scores. This could mean that the "Target Length" is a more flexible parameter, while "Confidence" is constrained by other factors. The marginal distributions provide insight into the range and typical values of each variable independently. The overall plot suggests that other variables likely play a more significant role in determining "Confidence" than "Target Length" alone.