## Diagram: Multi-Stage Process Comparison
### Overview
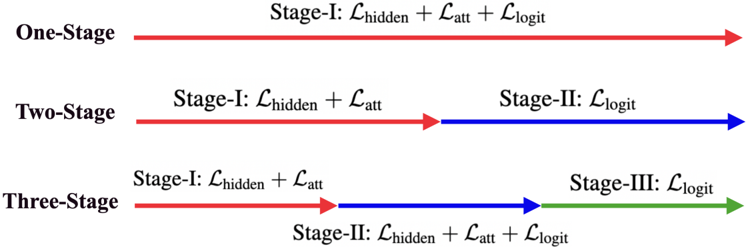
The image illustrates a comparison of one-stage, two-stage, and three-stage processes, likely in the context of a machine learning or computational workflow. Each process is represented by a horizontal arrow, with different colors indicating different stages and associated loss functions.
### Components/Axes
* **Process Labels (Left):**
* One-Stage
* Two-Stage
* Three-Stage
* **Stages (Above Arrows):** Stage-I, Stage-II, Stage-III
* **Loss Functions (Above Arrows):** L<sub>hidden</sub>, L<sub>att</sub>, L<sub>logit</sub>
* **Arrows:** Represent the flow of the process. Arrow color indicates the stage.
### Detailed Analysis
* **One-Stage:**
* A single red arrow labeled "Stage-I: L<sub>hidden</sub> + L<sub>att</sub> + L<sub>logit</sub>".
* **Two-Stage:**
* A red arrow labeled "Stage-I: L<sub>hidden</sub> + L<sub>att</sub>" transitions into a blue arrow labeled "Stage-II: L<sub>logit</sub>".
* **Three-Stage:**
* A red arrow labeled "Stage-I: L<sub>hidden</sub> + L<sub>att</sub>" transitions into a blue arrow labeled "Stage-II: L<sub>hidden</sub> + L<sub>att</sub> + L<sub>logit</sub>", which then transitions into a green arrow labeled "Stage-III: L<sub>logit</sub>".
### Key Observations
* The One-Stage process involves all three loss functions (hidden, attention, and logit) in a single stage.
* The Two-Stage process separates the hidden and attention loss functions from the logit loss function.
* The Three-Stage process further divides the loss functions, with the second stage including all three loss functions and the final stage focusing solely on the logit loss function.
### Interpretation
The diagram visually represents the decomposition of a process into multiple stages, each potentially focusing on different aspects or loss functions. The progression from one-stage to three-stage suggests an increasing level of modularity or specialization in the process. The loss functions (L<sub>hidden</sub>, L<sub>att</sub>, L<sub>logit</sub>) likely represent different components of the overall objective function being optimized in the process. The diagram highlights how these loss functions are distributed across different stages in each process.