## Diagram: LNN Structure
### Overview
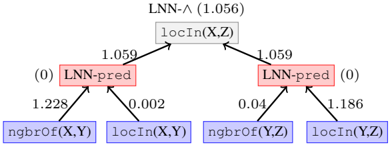
The image presents a diagram illustrating the structure of a Logical Neural Network (LNN). It shows the relationships between different components, including LNN-pred nodes and locIn/ngbrof nodes, along with associated numerical values representing weights or probabilities.
### Components/Axes
* **Nodes:**
* `LNN-^ (1.056)`: Top-level node, likely representing a conjunction (AND) operation in the LNN. The value 1.056 is associated with this node.
* `locIn(X,Z)`: A node representing the location of X in Z. It is connected to the `LNN-^` node.
* `LNN-pred`: Two nodes labeled "LNN-pred" with associated values of (0). These are likely prediction nodes within the LNN.
* `ngbrof(X,Y)`: A node representing the neighborhood of X in Y.
* `locIn(X,Y)`: A node representing the location of X in Y.
* `ngbrof(Y,Z)`: A node representing the neighborhood of Y in Z.
* `locIn(Y,Z)`: A node representing the location of Y in Z.
* **Edges:** Arrows indicate the flow of information or dependencies between nodes.
* **Weights/Values:** Numerical values are associated with the edges, representing weights or probabilities.
### Detailed Analysis
* **Top Node:** The `LNN-^ (1.056)` node is at the top of the diagram.
* **locIn(X,Z) Node:** Directly below the top node is the `locIn(X,Z)` node.
* **LNN-pred Nodes:** Two `LNN-pred` nodes are positioned below and to the left and right of the `locIn(X,Z)` node. Each has a value of (0).
* **Bottom Nodes:** Four nodes are at the bottom: `ngbrof(X,Y)`, `locIn(X,Y)`, `ngbrof(Y,Z)`, and `locIn(Y,Z)`.
* **Edge Values:**
* `ngbrof(X,Y)` to left `LNN-pred`: 1.228
* `locIn(X,Y)` to left `LNN-pred`: 0.002
* `ngbrof(Y,Z)` to right `LNN-pred`: 0.04
* `locIn(Y,Z)` to right `LNN-pred`: 1.186
* left `LNN-pred` to `locIn(X,Z)`: 1.059
* right `LNN-pred` to `locIn(X,Z)`: 1.059
### Key Observations
* The diagram represents a hierarchical structure, with information flowing from the bottom nodes to the top node.
* The `LNN-pred` nodes appear to aggregate information from the `ngbrof` and `locIn` nodes.
* The values on the edges likely represent the strength or importance of the connections between nodes.
### Interpretation
The diagram illustrates a specific configuration of an LNN, likely used for reasoning about spatial relationships. The `LNN-^` node suggests a conjunctive query or rule. The `locIn` and `ngbrof` nodes represent spatial predicates, and the `LNN-pred` nodes likely perform intermediate computations or predictions based on these predicates. The numerical values associated with the edges indicate the weights or probabilities assigned to these relationships, influencing the final outcome of the LNN. The structure suggests a logical inference process where the location and neighborhood relationships between entities (X, Y, Z) are used to derive a higher-level conclusion.