\n
## Diagram: LNN-pred Dependency Graph
### Overview
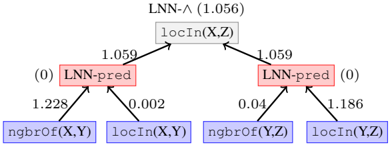
The image depicts a directed acyclic graph representing dependencies in a model labeled "LNN-pred". The graph shows how different features or components influence the final prediction. The nodes represent these features, and the edges represent the strength of the dependency, indicated by numerical values.
### Components/Axes
The diagram consists of rectangular nodes connected by directed arrows. Each arrow is labeled with a numerical value representing the weight or strength of the dependency. The nodes are labeled with feature names like "LNN-pred", "locIn(X,Z)", "ngbrOf(X,Y)", and "locIn(X,Y)". There is a top-level node labeled "LNN-Λ (1.056)". Some nodes have a "(0)" label next to them.
### Detailed Analysis
The graph can be described as follows:
* **Top Node:** "LNN-Λ (1.056)" is at the top center.
* **Second Layer:** Two "LNN-pred" nodes (both colored in a light red) are positioned below "LNN-Λ". Both have a "(0)" label.
* **Connections to Top Node:** Each "LNN-pred" node is connected to "LNN-Λ" with an edge weight of 1.059.
* **Third Layer:** Below the "LNN-pred" nodes are four nodes colored in light blue: "ngbrOf(X,Y)", "locIn(X,Y)", "ngbrOf(Y,Z)", and "locIn(Y,Z)".
* **Connections to Second Layer:**
* The left "LNN-pred" node is connected to "ngbrOf(X,Y)" with a weight of 1.228 and to "locIn(X,Y)" with a weight of 0.002.
* The right "LNN-pred" node is connected to "ngbrOf(Y,Z)" with a weight of 0.04 and to "locIn(Y,Z)" with a weight of 1.186.
* **Node Labels:** The nodes are labeled with function-like names, suggesting they represent features or operations within the model. The "locIn" and "ngbrOf" labels suggest location-based and neighborhood-based features, respectively.
### Key Observations
* The "LNN-pred" nodes appear to be central to the model, receiving input from multiple features.
* The weights connecting "LNN-pred" to "ngbrOf(X,Y)" and "locIn(Y,Z)" are significantly higher (1.228 and 1.186) than the weights connecting "LNN-pred" to "locIn(X,Y)" and "ngbrOf(Y,Z)" (0.002 and 0.04). This suggests that these features have a stronger influence on the prediction.
* The "(0)" label next to the "LNN-pred" nodes might indicate a default value or a specific state.
* The top node "LNN-Λ" acts as a convergence point for the two "LNN-pred" nodes.
### Interpretation
This diagram represents a simplified dependency graph for a model, likely related to a location-based prediction task ("locIn" suggests location). The "LNN-pred" nodes likely represent intermediate predictions, and the graph shows how these predictions are influenced by neighborhood features ("ngbrOf") and location information ("locIn"). The higher weights on the connections to "ngbrOf(X,Y)" and "locIn(Y,Z)" suggest that the model relies more heavily on these features for making predictions. The "LNN-Λ" node could represent a final aggregation or combination of the "LNN-pred" outputs. The "(0)" labels on the "LNN-pred" nodes could indicate a baseline or initial state for these predictions. The graph provides a visual representation of the model's architecture and the relative importance of different features.